CSIEM User Documentation
Dashboard
Search
- Query History
- Query Example
- Save Query
- Query Keywords
- Source
- Source Category
- Source Type
- Source Tag
- Save Button Popup
- Save query Example
- Saved Queries
- Search Timespan
- Timespan Example
Reports
Alerts
Assets
Index Management
Source Types
Classification
Dashboards
Dashboards are graphical visualization of data. They help users understand and quickly analyse important data. Dashboards help the users to classify, categorize and group data. They also provide comparison between multiple types of data or entities.
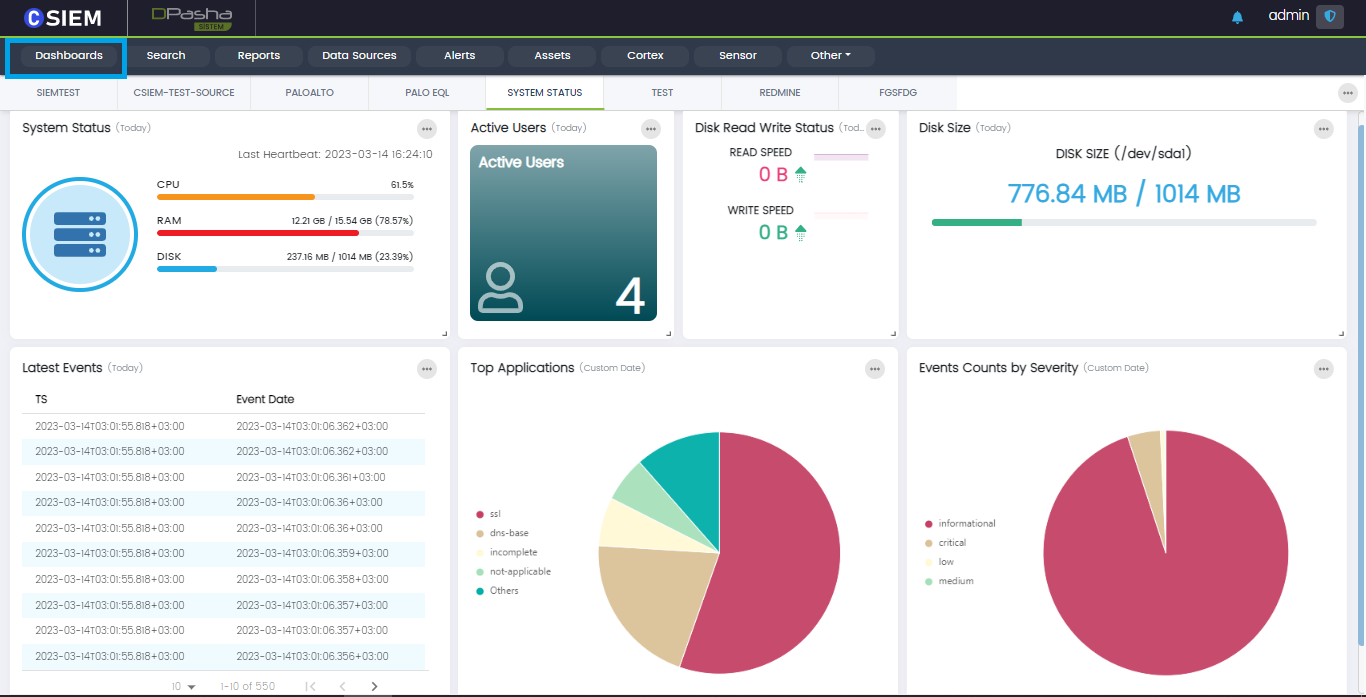
Dashboard Widgets
The dashboard is composed of widgets which are basically visualizations created based on queries or log sources and other types of data filters. Each widget comes with different options.
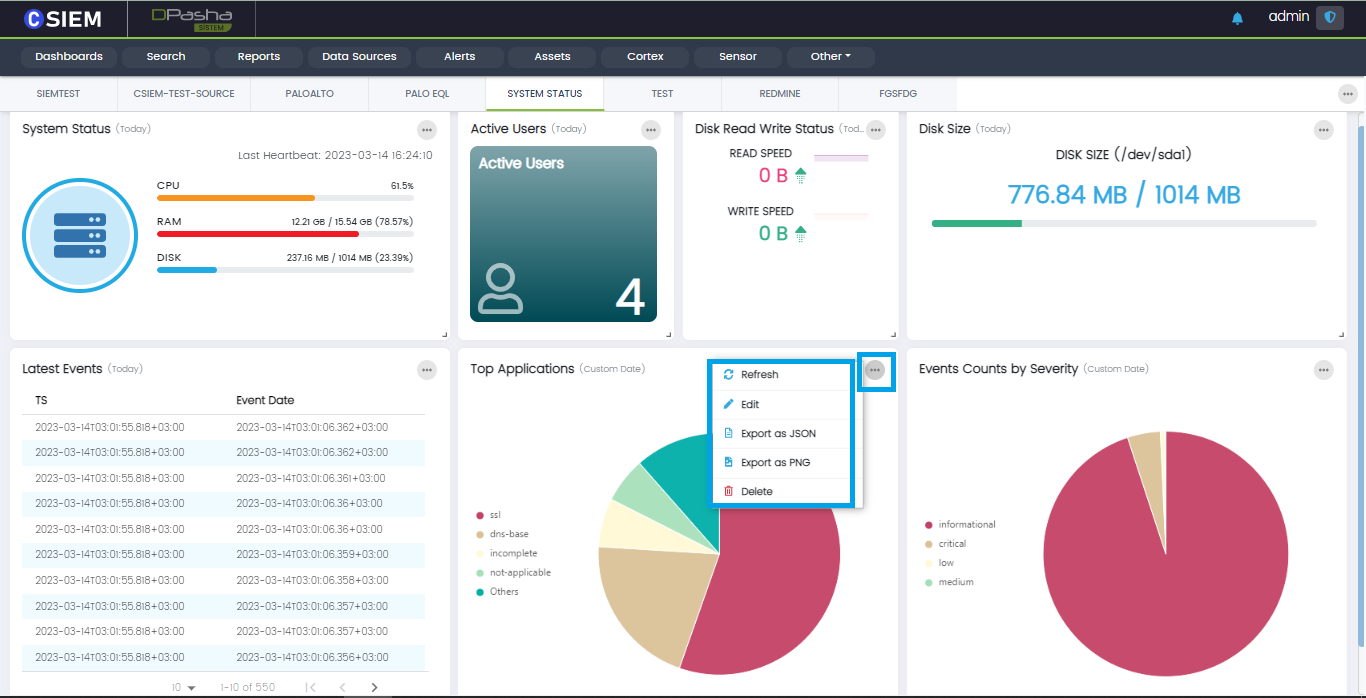
Users can click the “dotted” icon on the top right of any widget to explore its options as shown below:
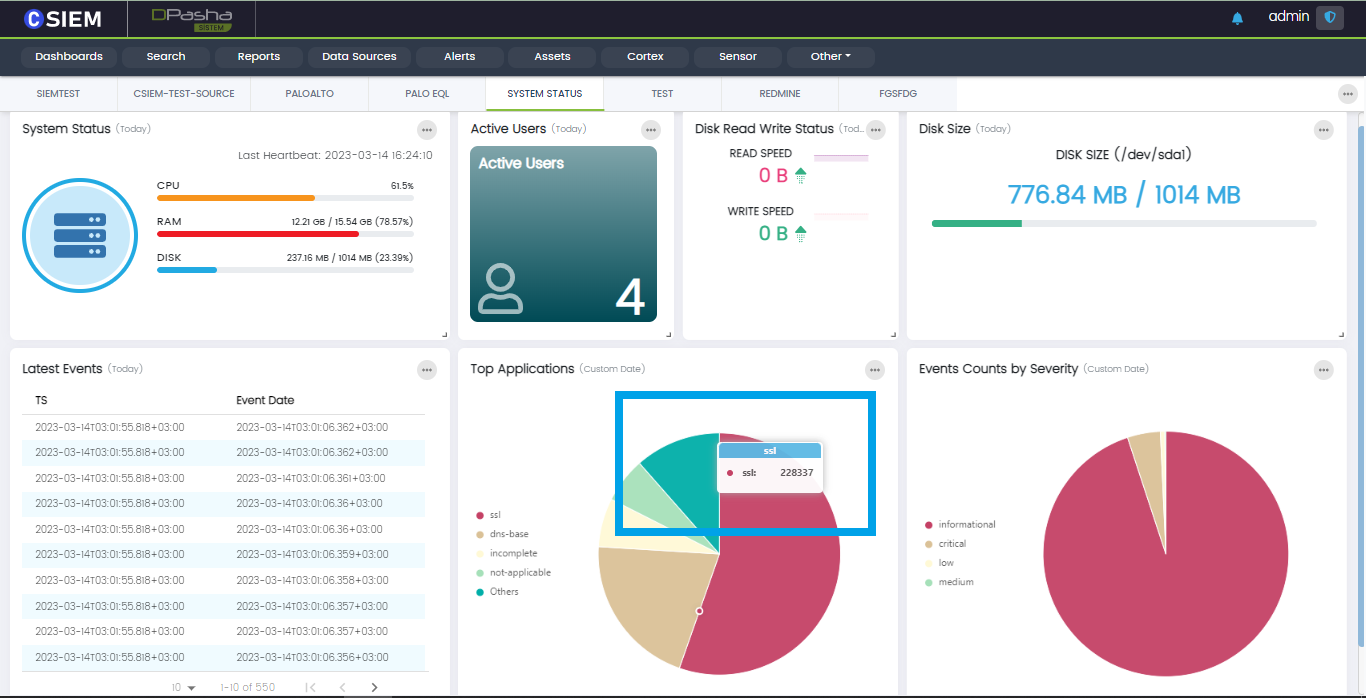
Dashboard Hover
Users can hover over dashboard to have a quick bird-eye view of the data and statistics.
Dashboard Options
Users can select options for dashboard by clicking the “dotted” icon on the top right corner of dashboard page as shown below.
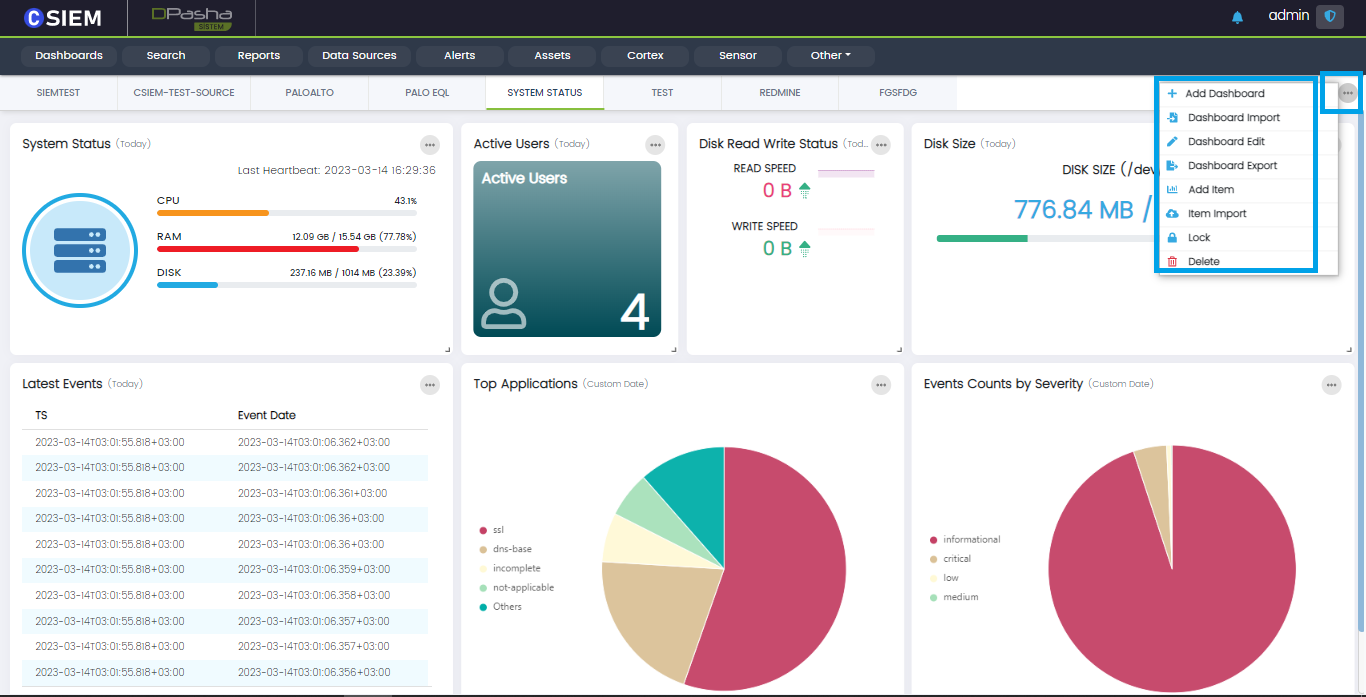
The dashboard options are listed below.
- Dashboard Import
- Dashboard Export
- Add Dashboard
- Dashboard Edit
- Item Import
- Add Item
- Lock
- Delete
Dashboard Items
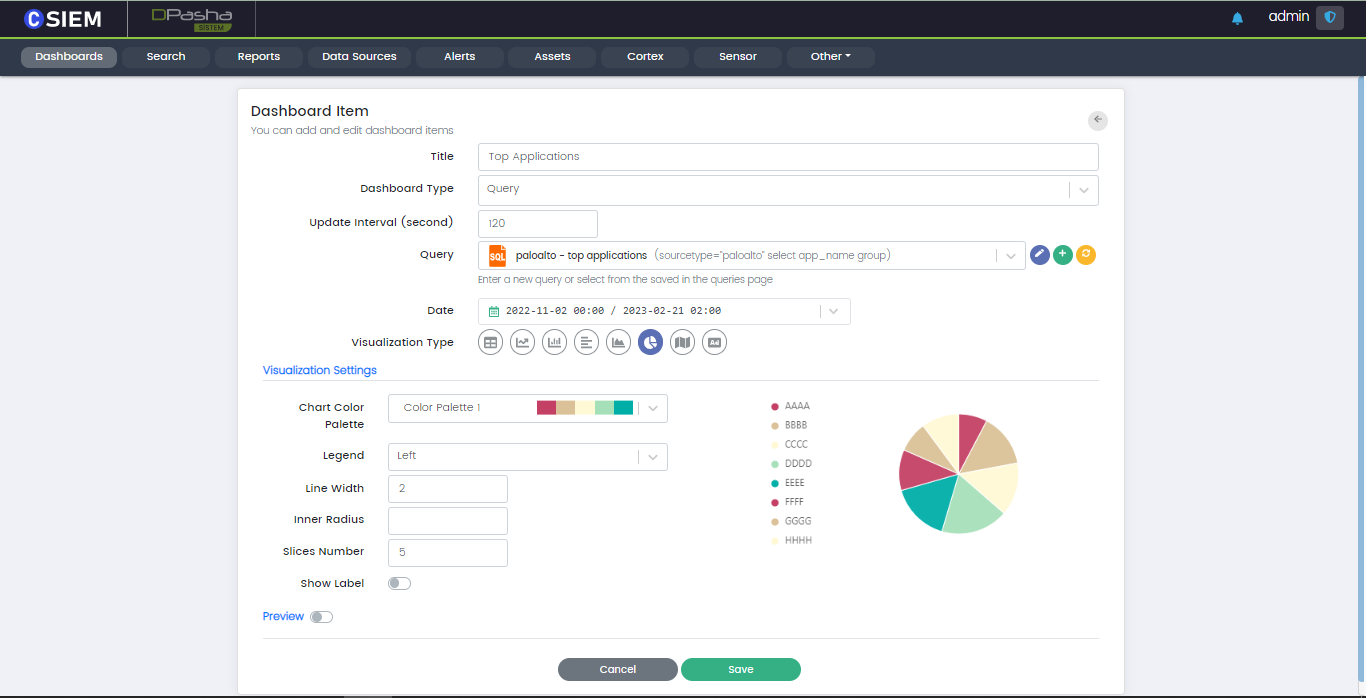
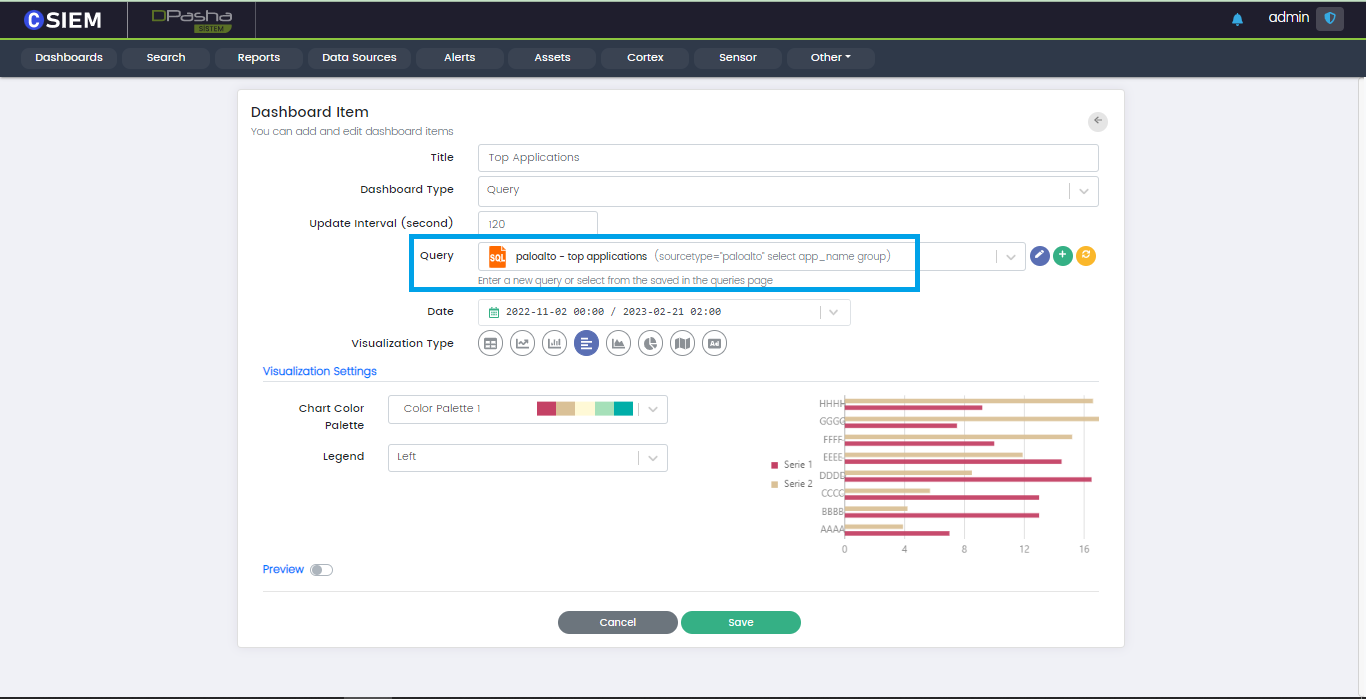
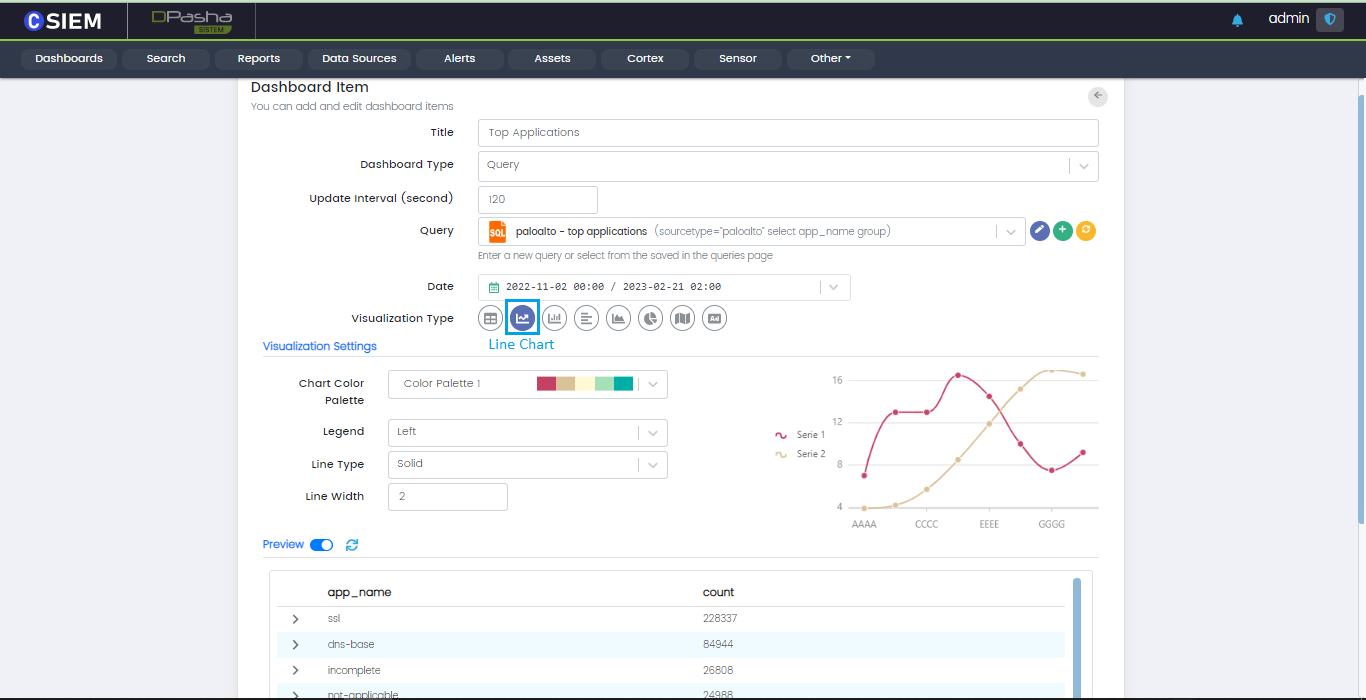
Users can add new dashboard items or update the existing ones. An example Dashboard Item page is shown below with the respective fields: i.e., Title, Type, Query, Update Interval, Visualization Type and Visualization Settings etc.
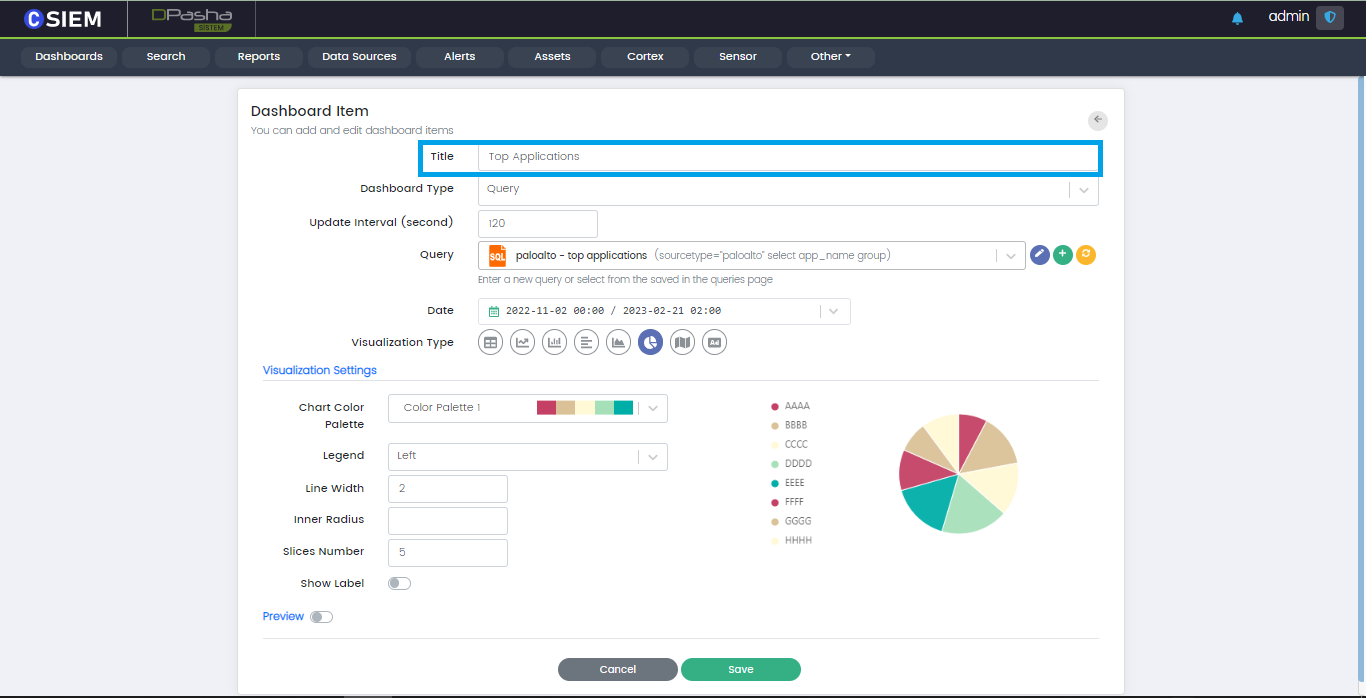
Title
This field is used for naming the dashboard item.
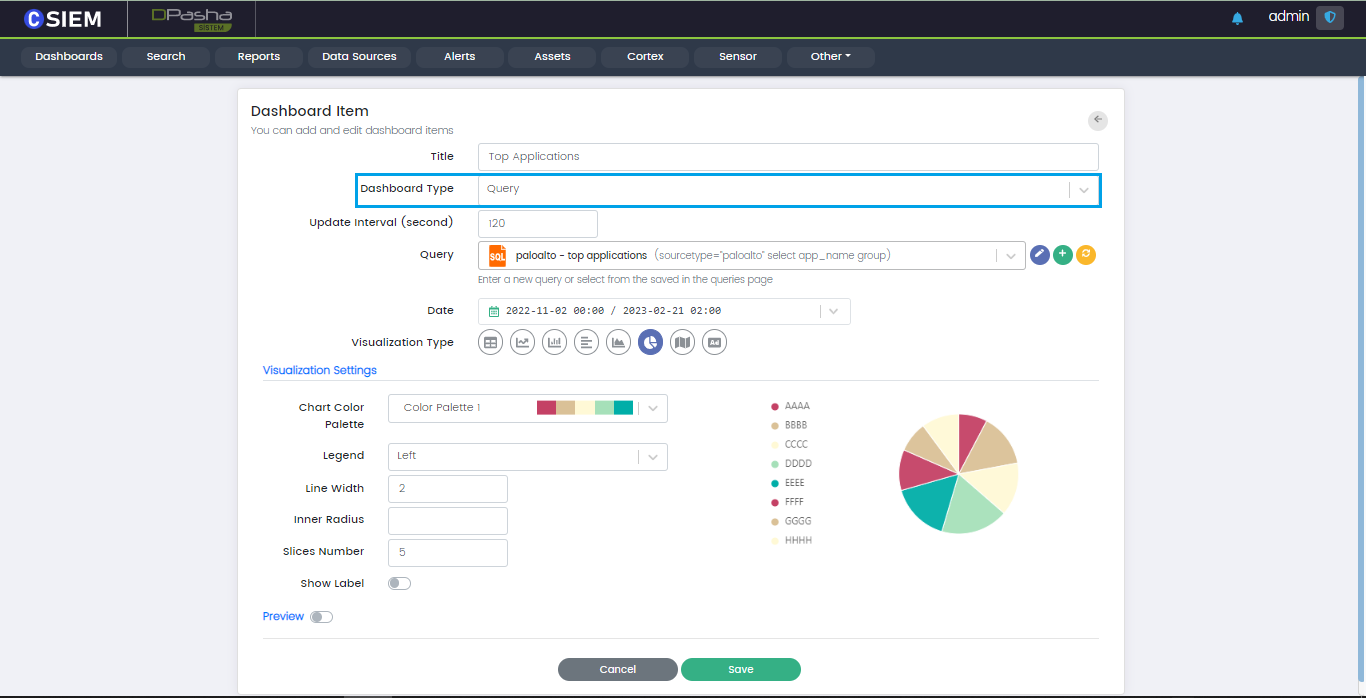
Dashboard Type
Users can create dashboards by selecting any of the predefined items:
- Active Users
- Disk Read Write Status
- Disk Size
- System Status
Users can select Query to create the dashboard from any of the saved queries.
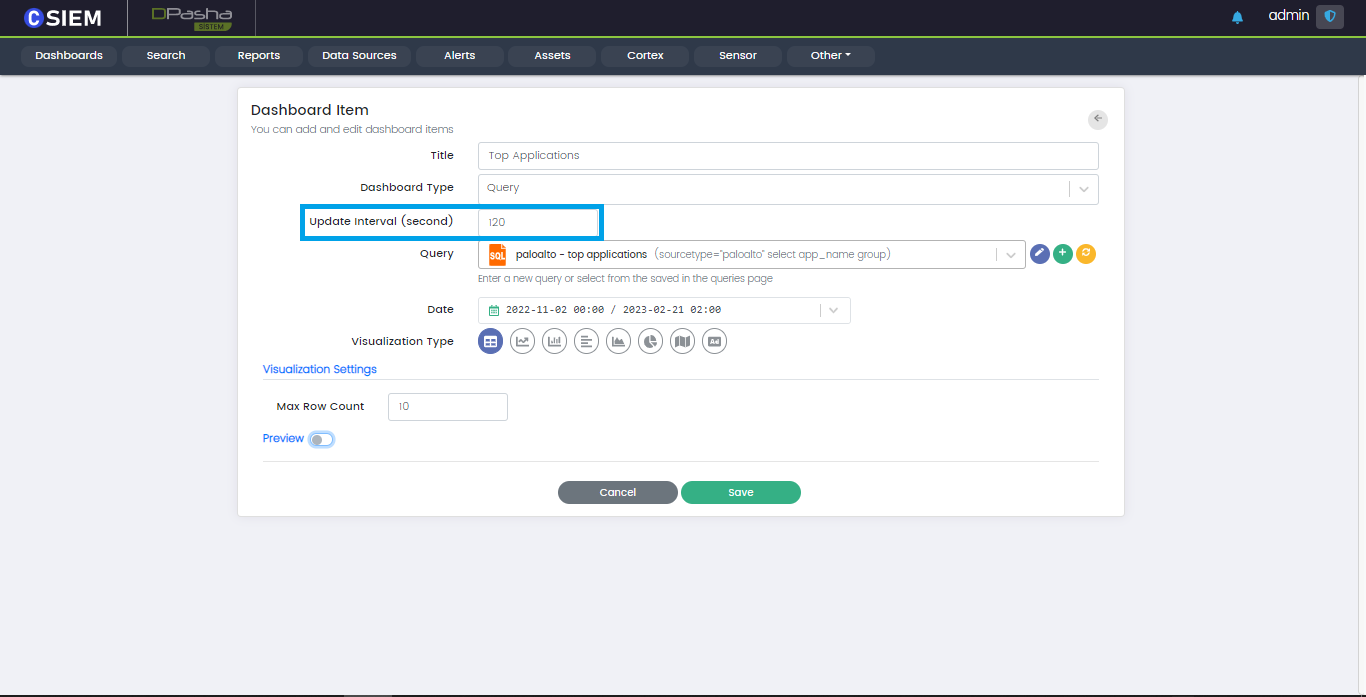
Update Interval
This field allows users to schedule the update of the Dashboard Item by specifying the time interval in seconds.
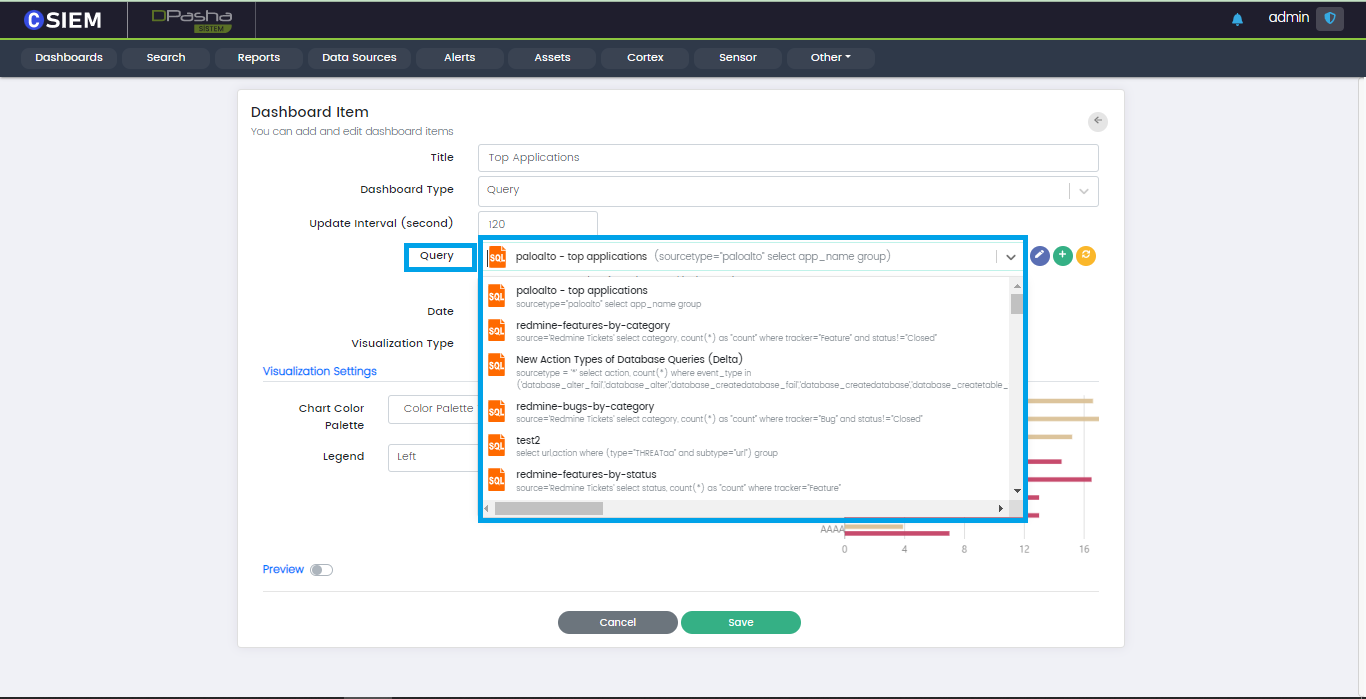
Query Field
Users can select anyone of the saved queries in this field to create a new dashboard based on one of them.
Query Dropdown
The Query field provides a dropdown menu to select one of the saved queries.
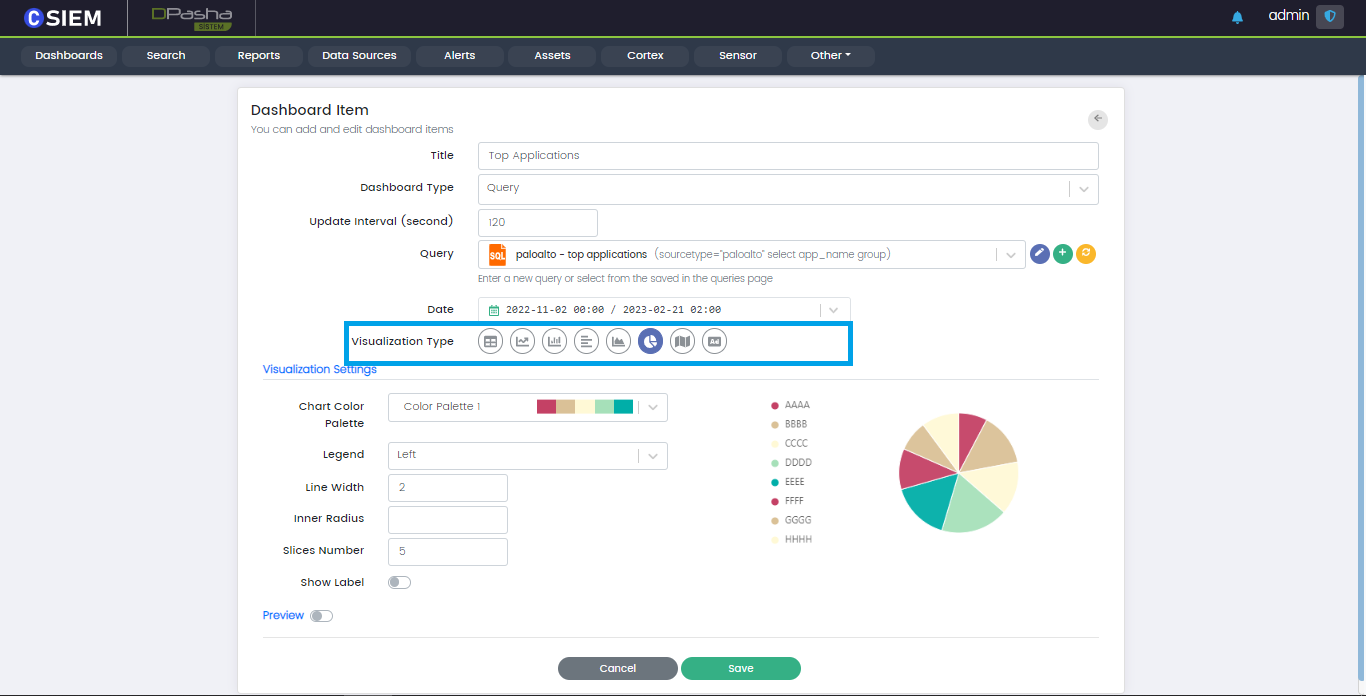
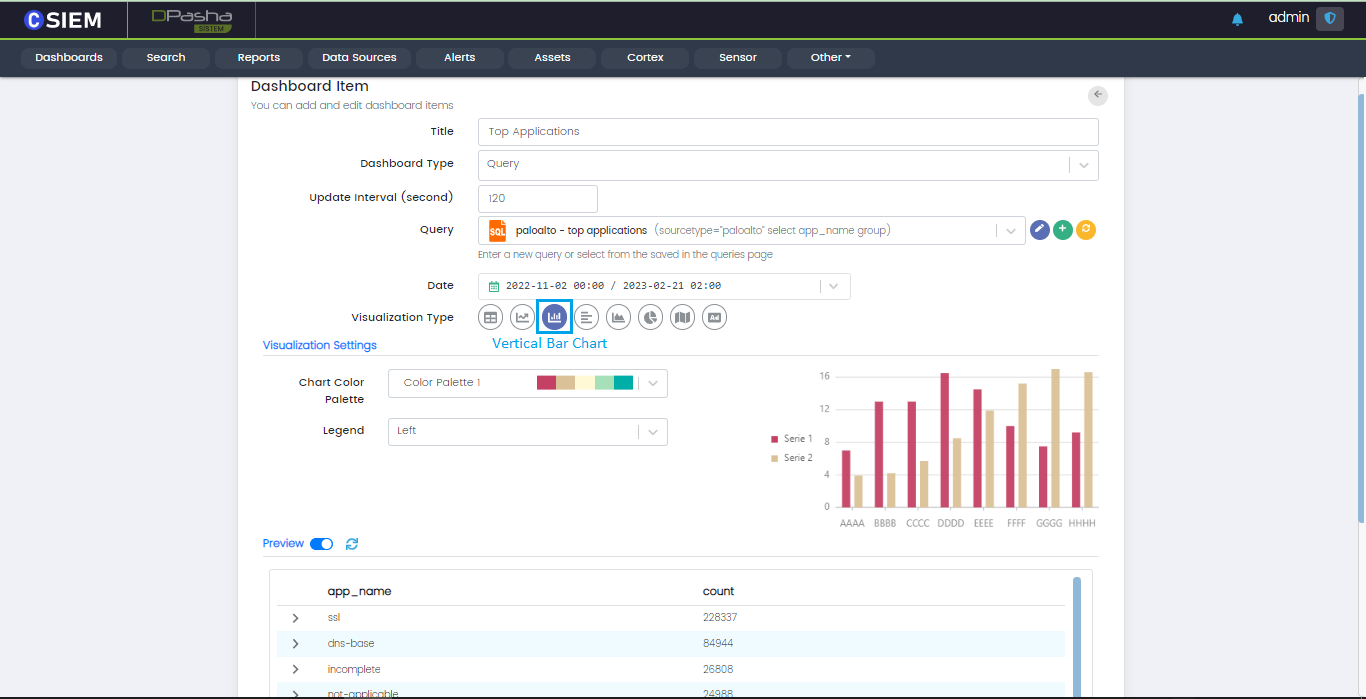
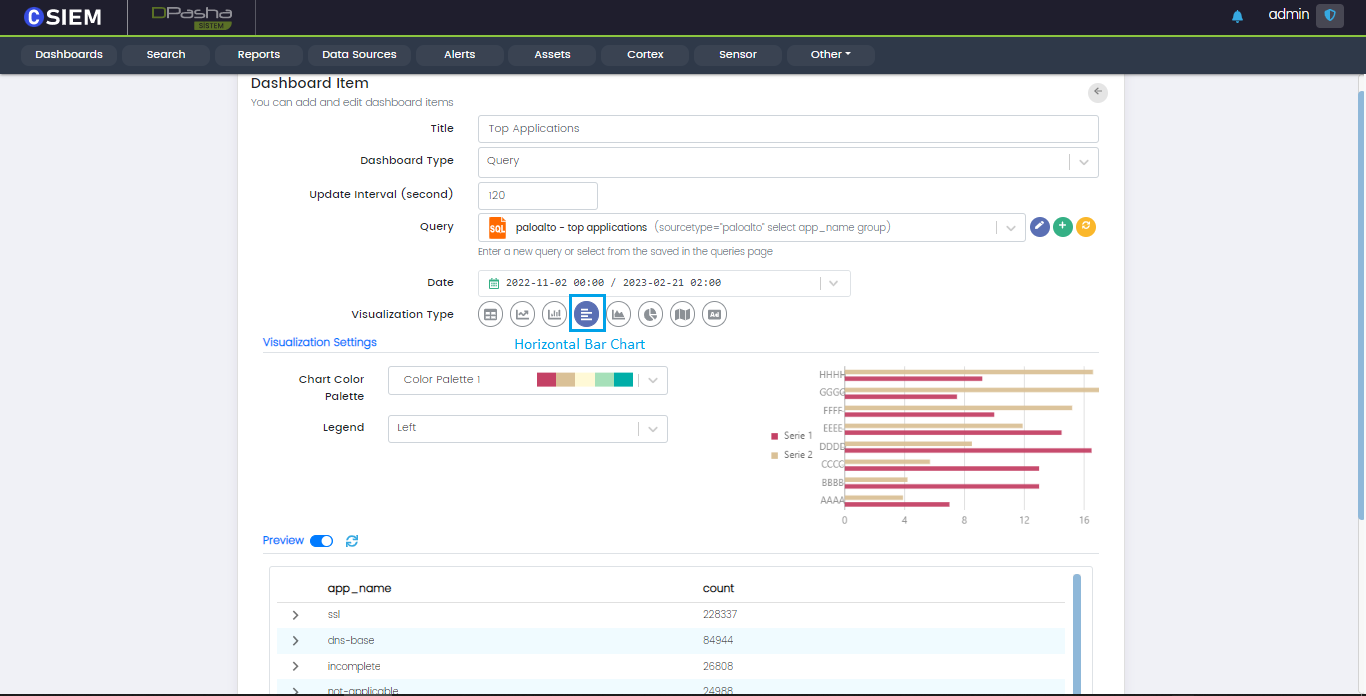
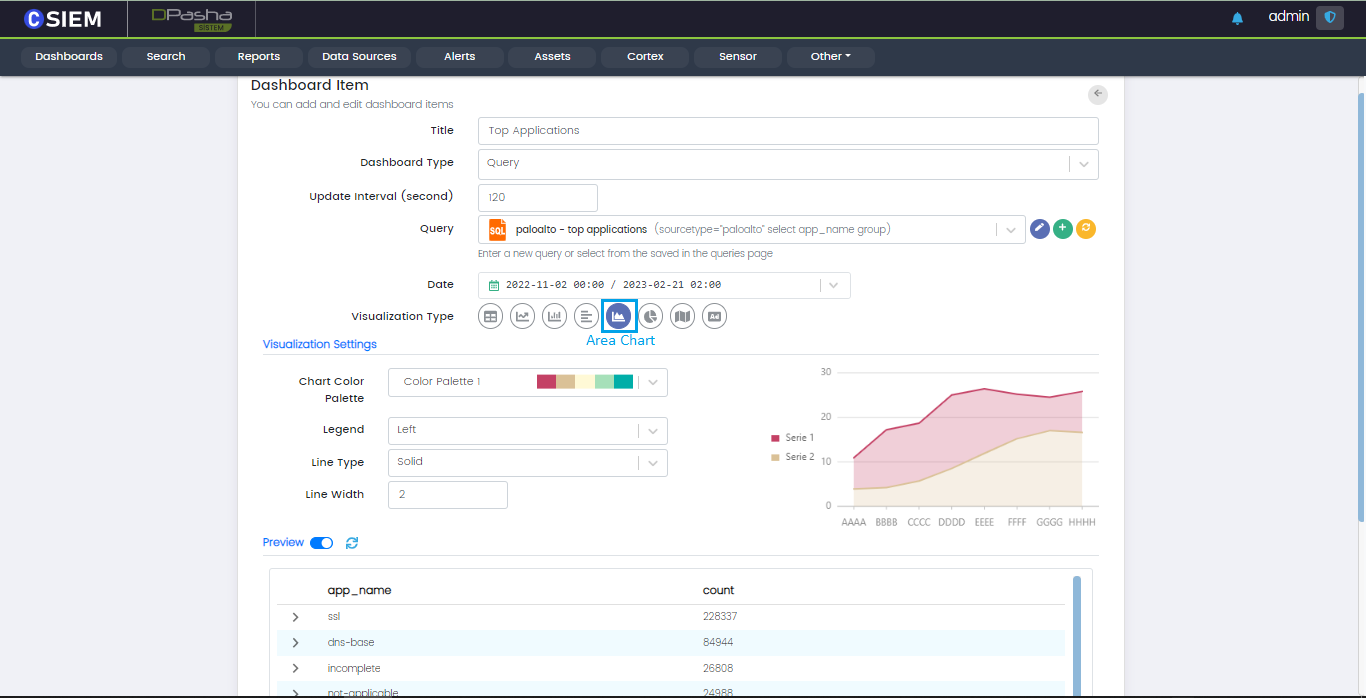
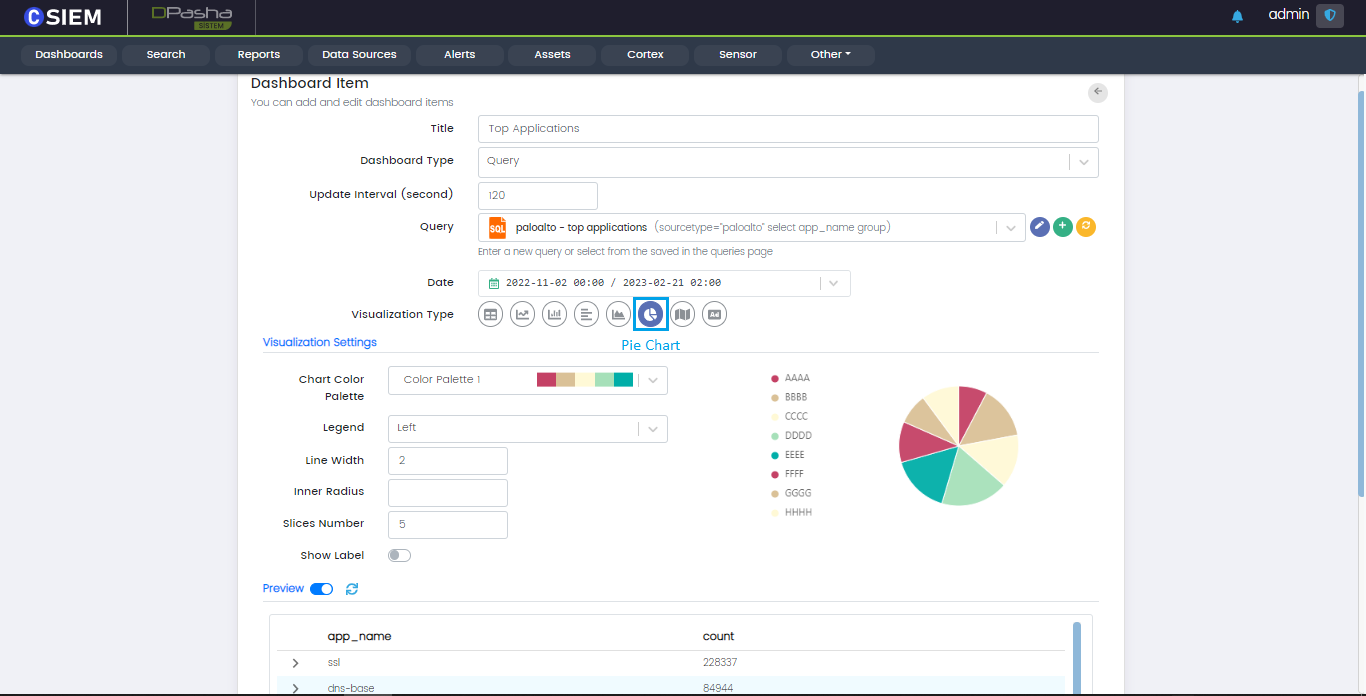
Visualization Type
Users can choose different Visualization for the data. Available visualization types are Table, Line chart, Vertical bar chart, Horizontal bar chart, Pie chart, Area chart, Map chart and image.
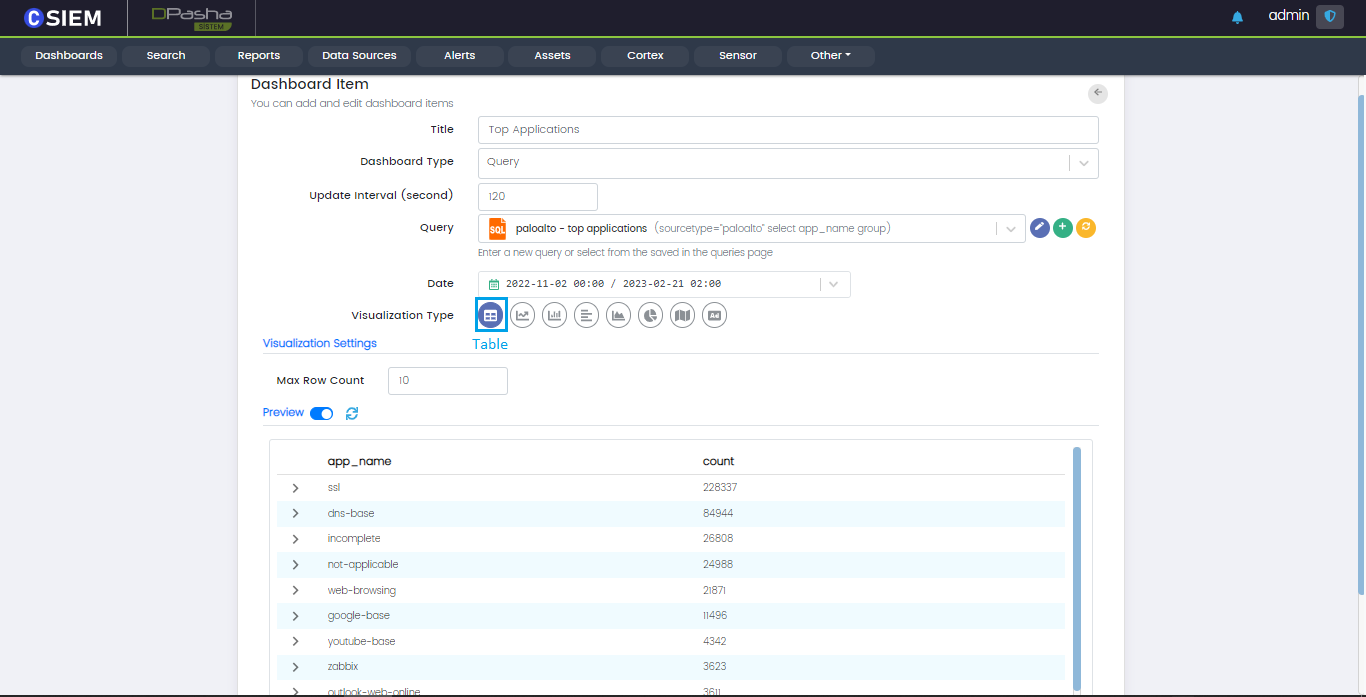
Table
Table is used to organize data that is too detailed or complicated to be described adequately in the text, allowing the user to quickly see the data.
Line Chart
Line charts are used to show information that changes over time. Also helps in tracking changes over short and long periods.
Vertical Bar Chart
Vertical bar chart is useful to compare different categorical or discrete variables.
Horizontal Bar Chart
Horizontal bar chart is similar to vertical bar chart with a different orientation and is also useful to compare different categorical or discrete variables.
Area Chart
Area chart represents cumulated totals using numbers or percentages (stacked area charts in this case) over time.
Pie Chart
Pie chart helps organize and show data as a percentage of a whole.
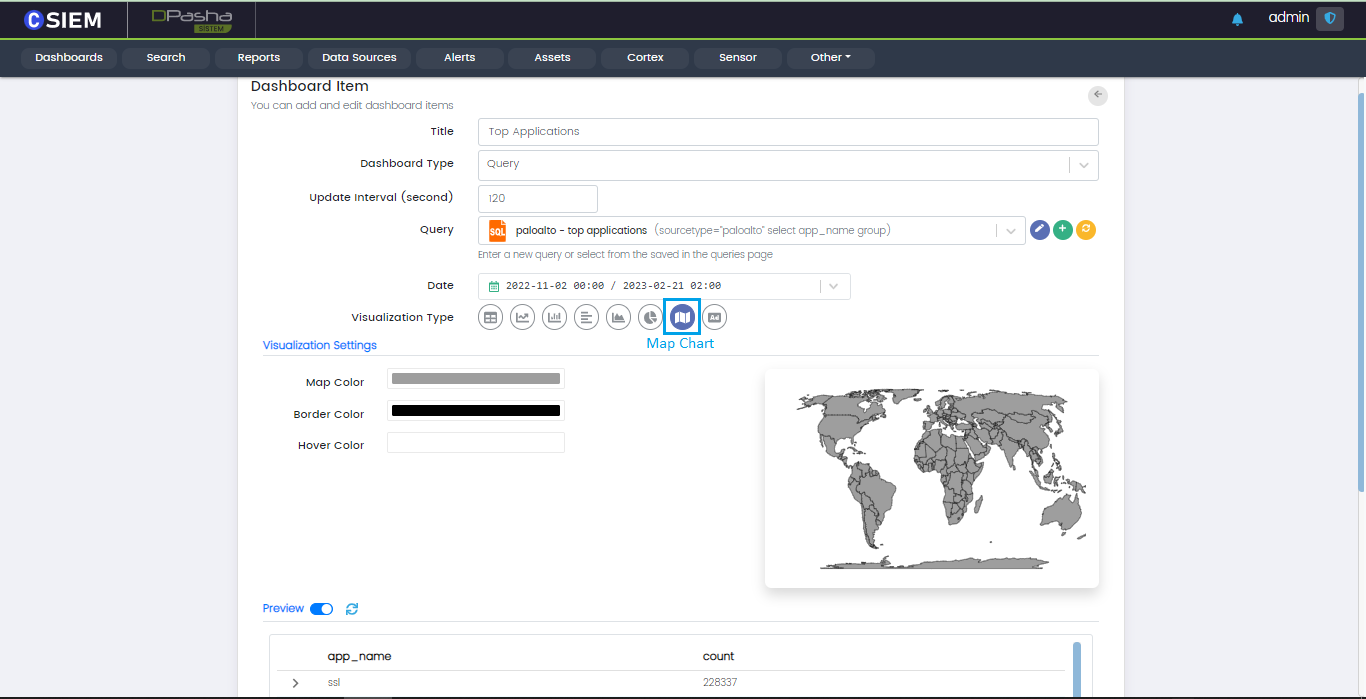
Map Chart
Map chart allows organizations to position data or visualize spatial relationships using geographical context.
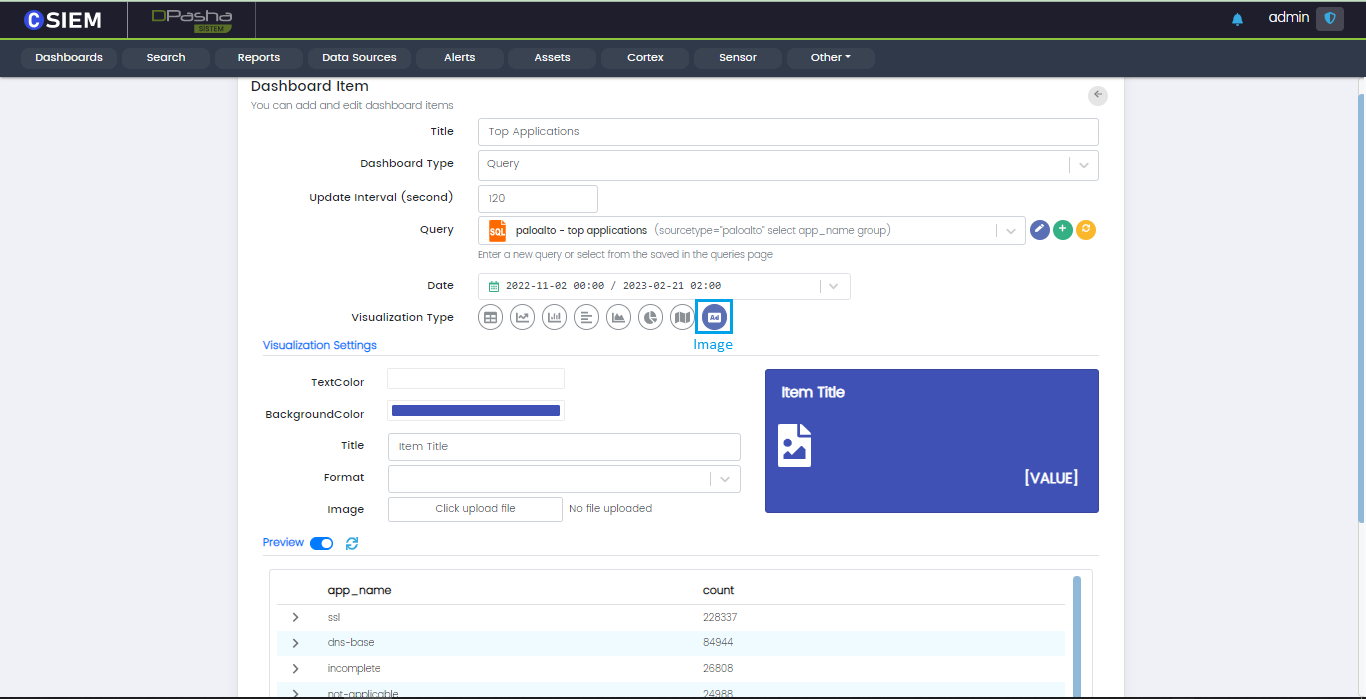
Image
The last type of visualization in an image icon as shown below.
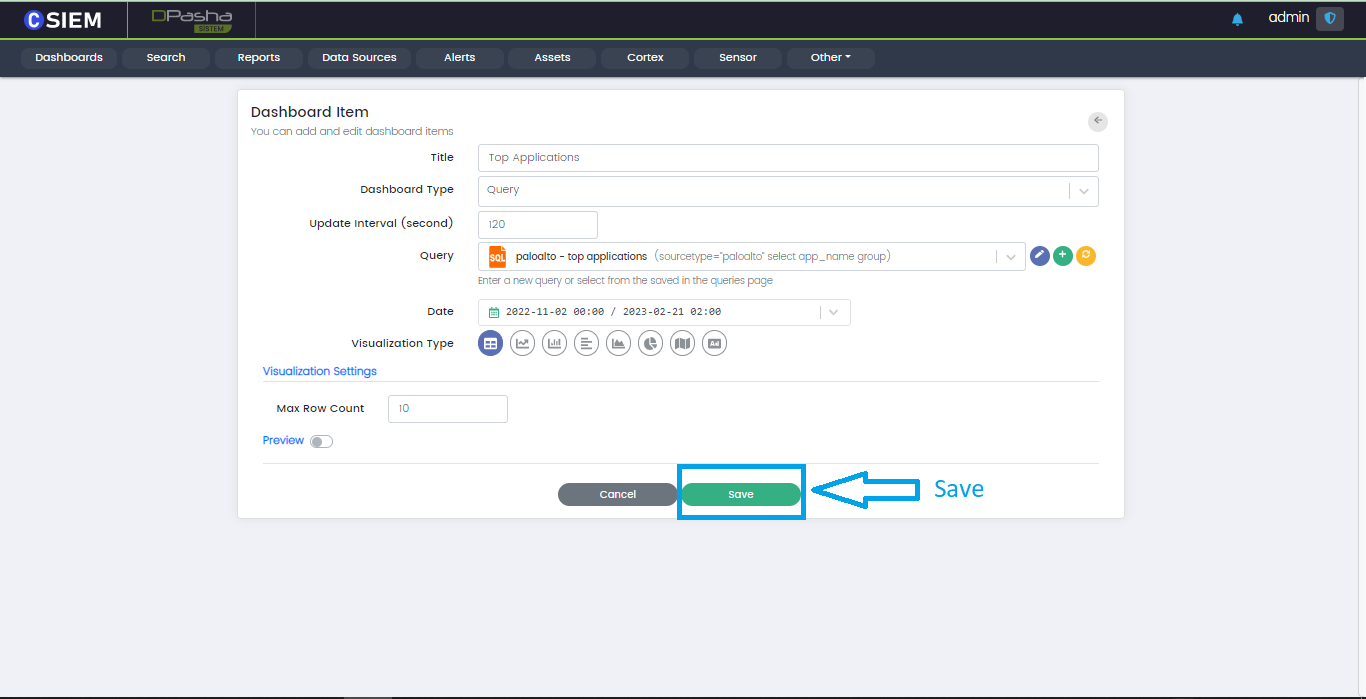
Save
Once all the respective fields are selected and a visualization is chosen, the user can save the Dashboard Item using the Save button at the bottom.
Search
CSIEM provides a search utility under the Search panel. Using this feature, users can query and extract the desired data from CSIEM.
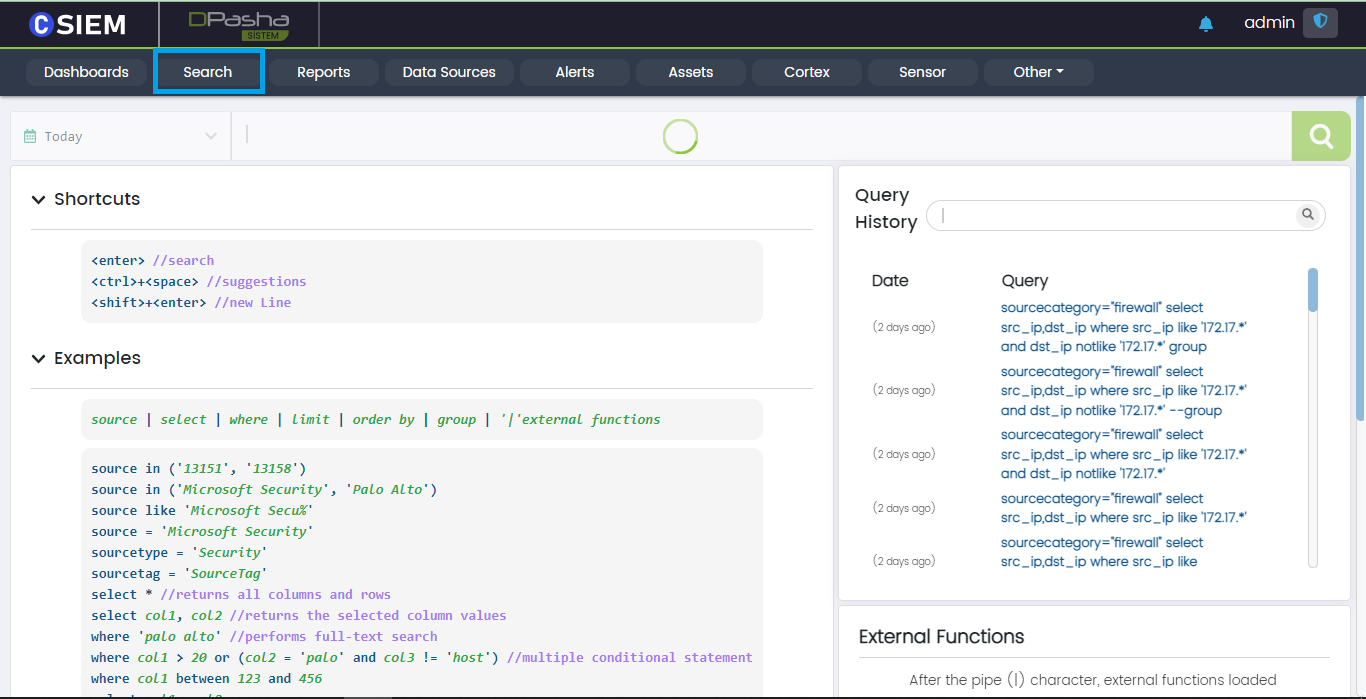
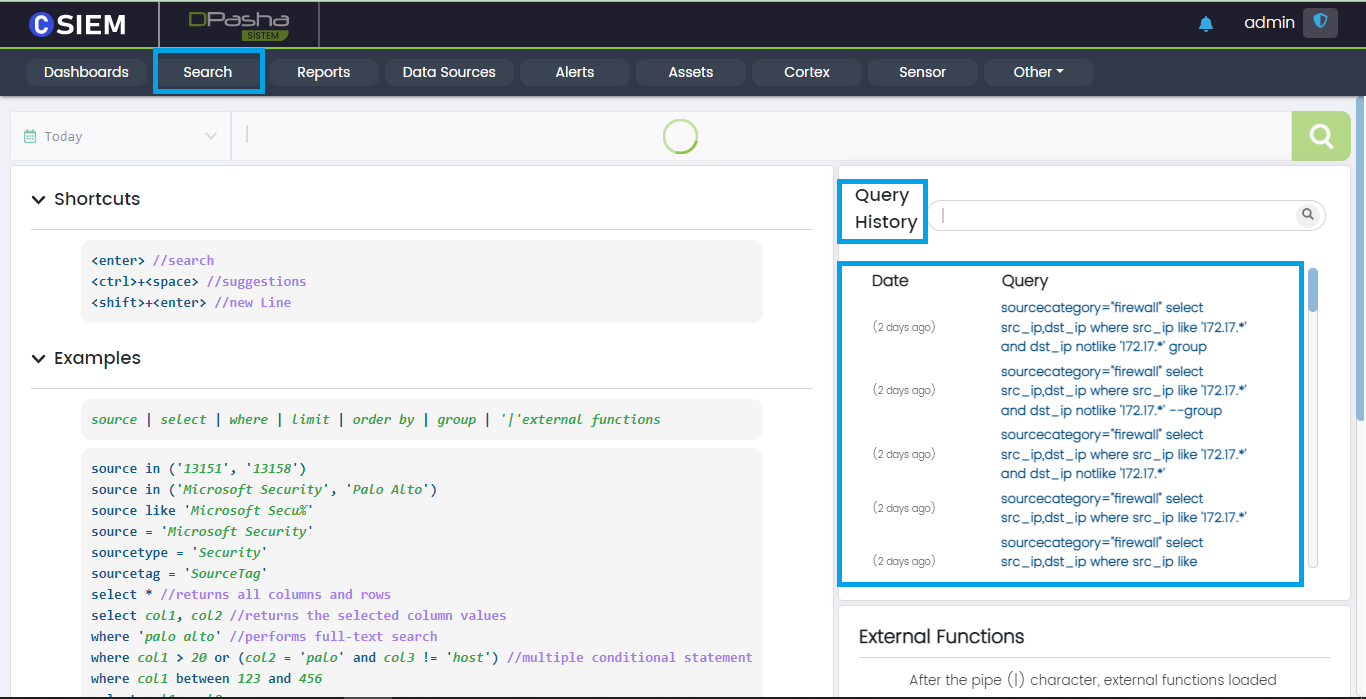
Query History
Search panel contains a column on the right side which shows the previous queries entered by the users on the system.
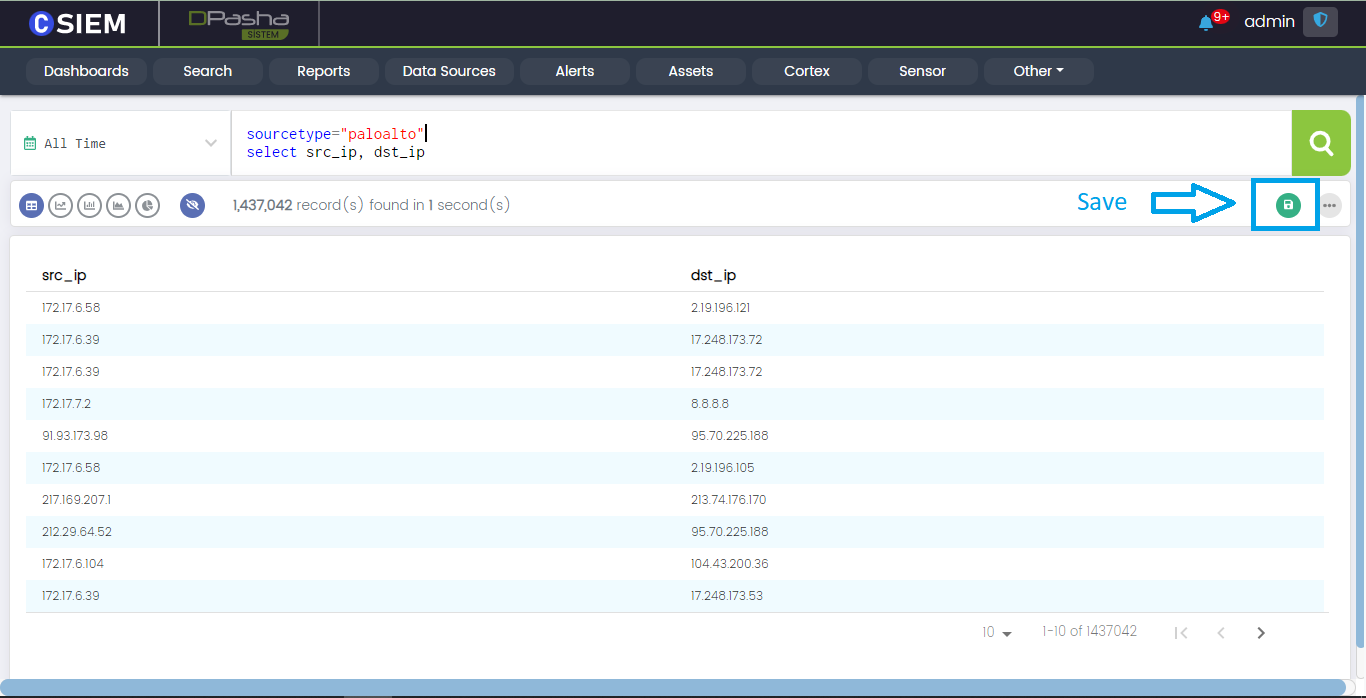
Query Example
- sourcetype ="paloalto" select src_ip, dst_ip
Here we select the source IP (src_ip) addresses and destination IP addresses (dst_ip) present in the data provided by the paloalto data source.
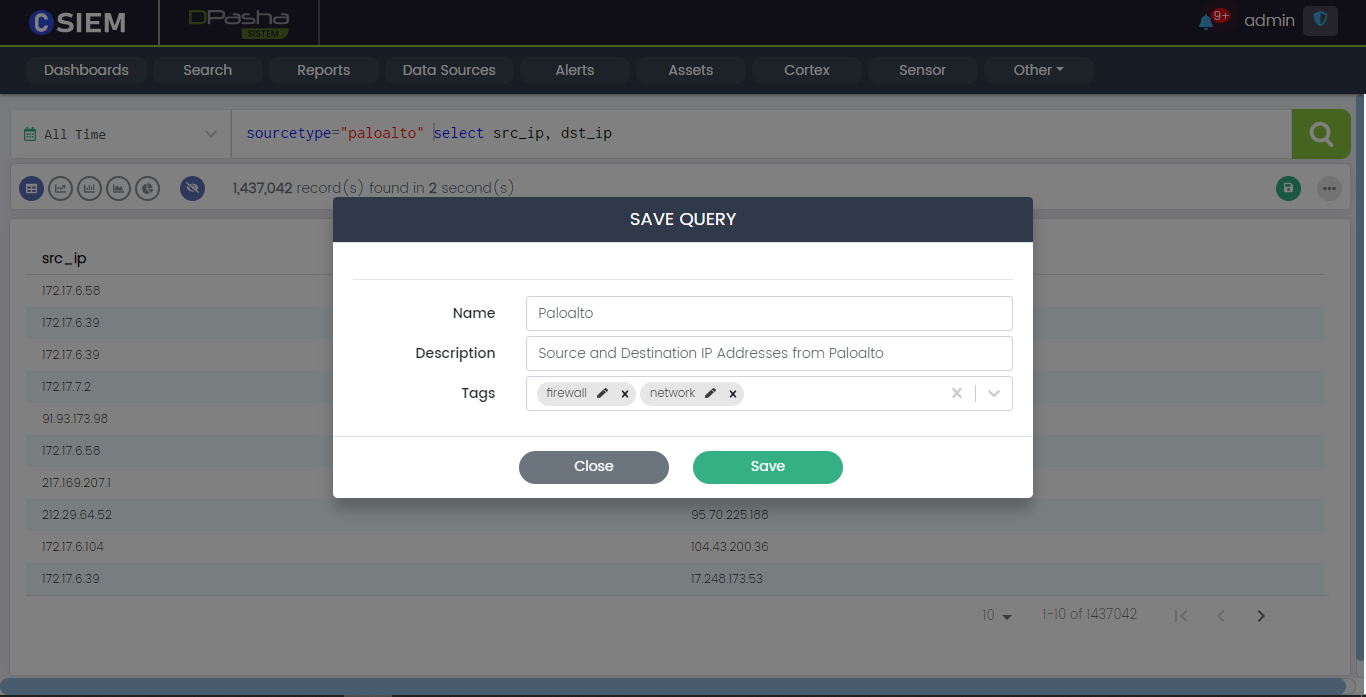
Save Query
Users can save a query by clicking the Save button on the right side under the Search bar as shown below:
Query Keywords
CSIEM query consists of different keywords which help the users to specify the source, category, type, and filter the data as required.
Source
If the users want to search from the data of a specific source, they can use the source keyword and specify the source. For example, source=”csiem-test-source".
Source Category
If the users want to search from the data of a specific category of source, they can use the sourcecategory keyword and specify the source. For example, sourcecategory=”web-access".
Source Type
If the users want to search from the data of a specific type of source, they can use the sourcetype keyword and specify the source. For example, sourcetype=”windows-security”.
Source Tag
Tags are used to classify a set of data into smaller and more specific subsets of data.
For example, a user has 1000 saved queries and needs to see the queries related to VPN. So, when user wants to create a query related to VPN, user can use a tag like VPN, and this will show only the queries related to VPN. Similarly, user can use other tags as the queries can be related to location, users, sources or networks etc.
If the users want to search using a certain tag from the sources, they can use the sourcetag keyword and specify the source. For example, sourcetag=”training".
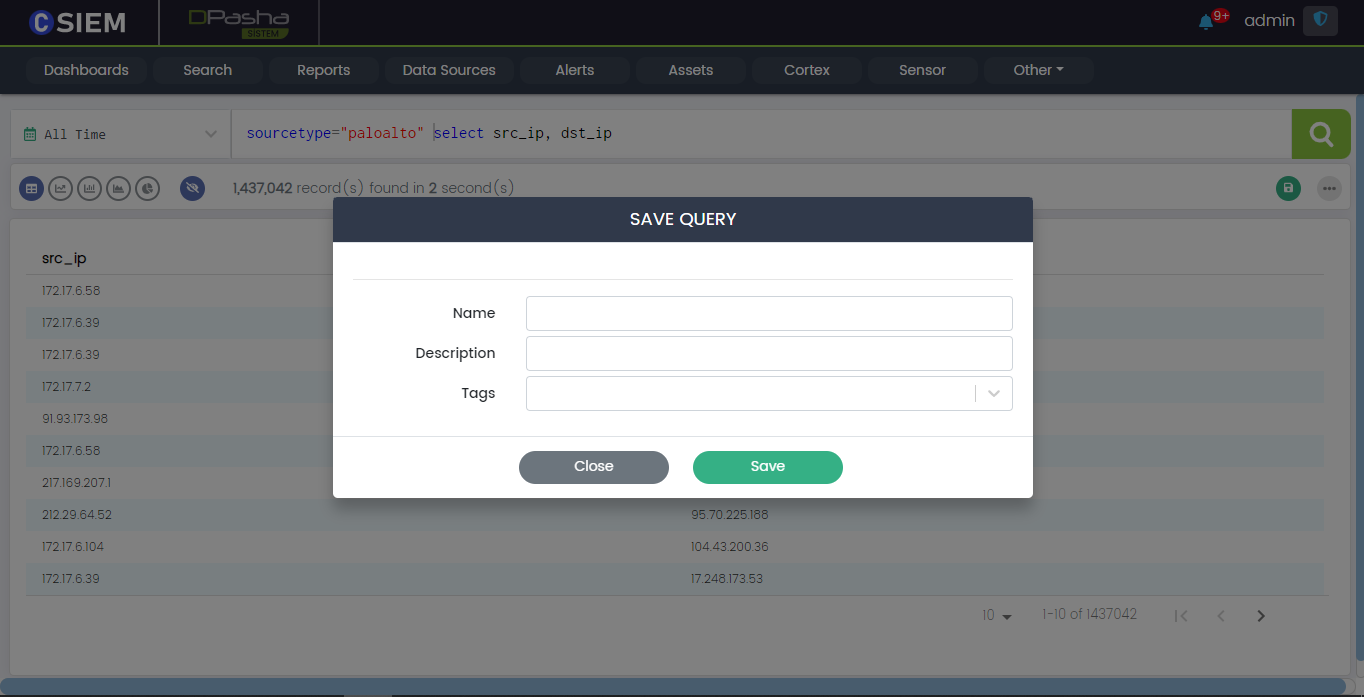
Save Button Popup
Clicking the Save button will show a popup with the following fields:
- Name (it represents a name for the saved query)
- Description (it helps in understanding the query)
- Tags (these can be used to classify the query)
Tags
For example, a user has 1000 saved queries and needs to see the queries related to VPN. So, when user wants to create a query related to VPN, user can use a tag like VPN, and this will show only the queries related to VPN. Similarly, user can use other tags as the queries can be related to location, users or networks etc.
Save query Example
Following is an example of how to save a query with the given fields.
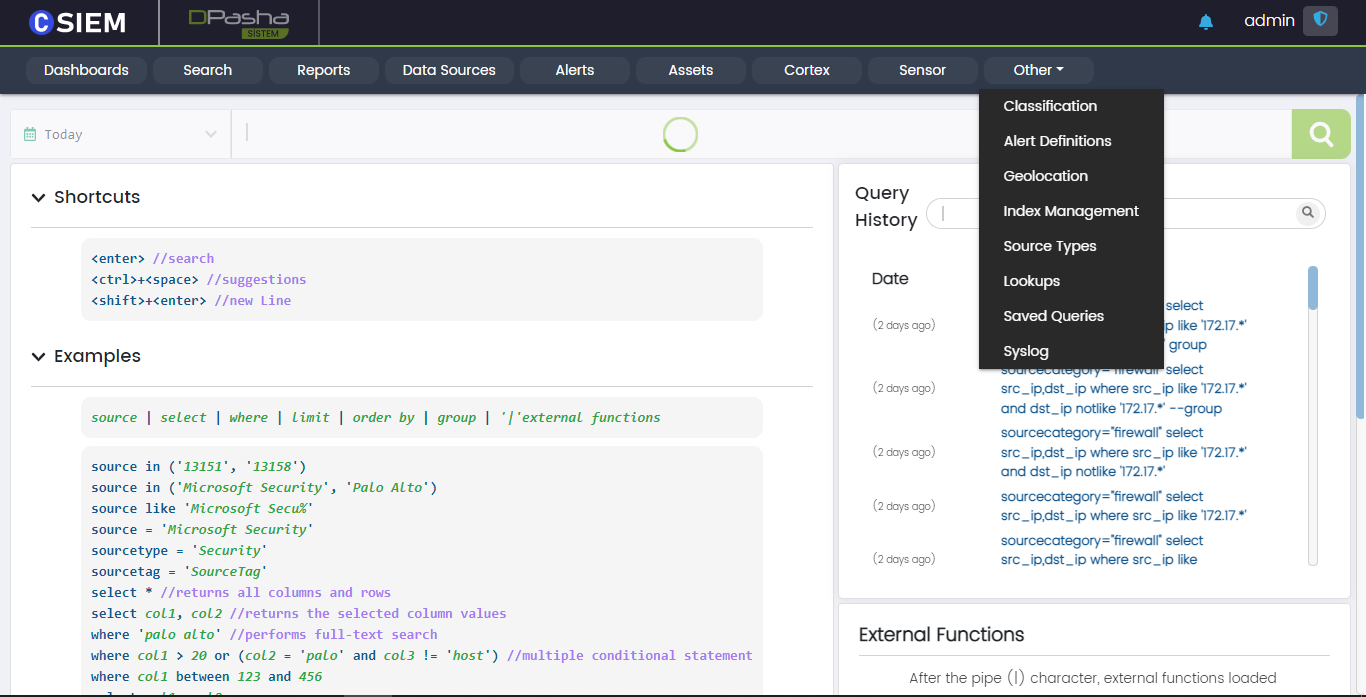
Saved Queries
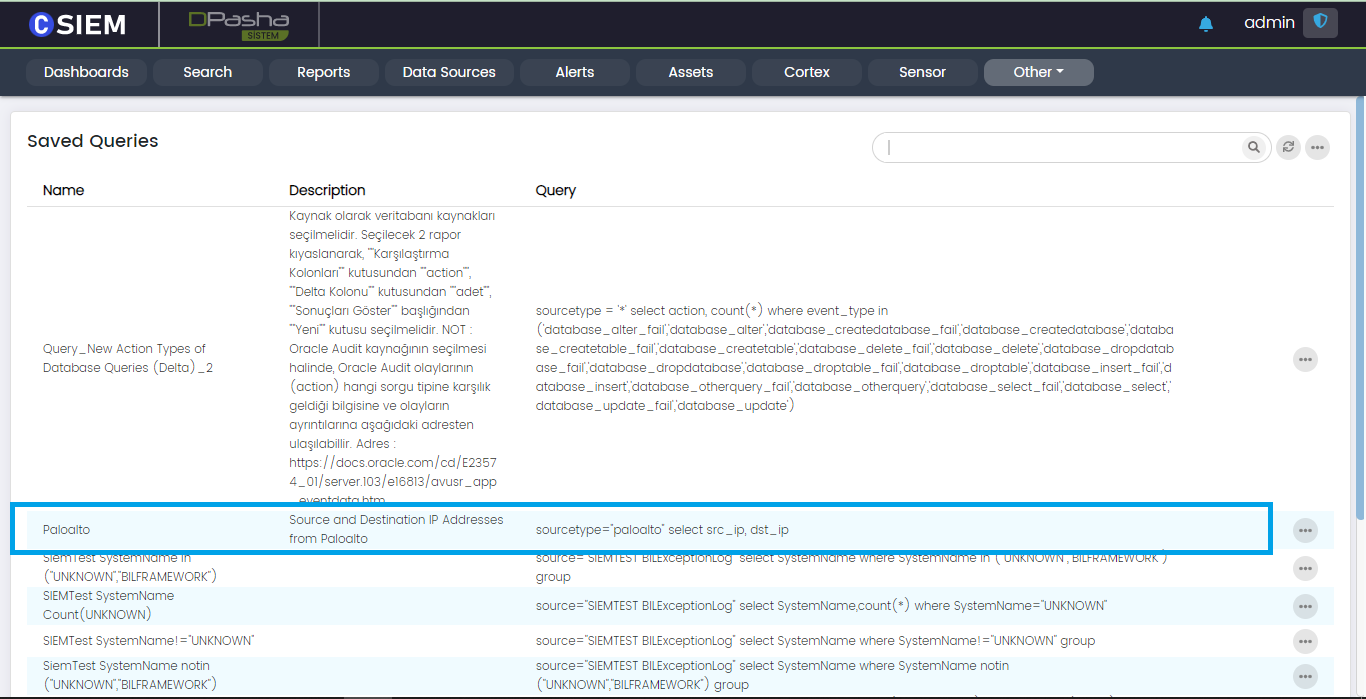
Once the query is saved, users can see saved queries on the “Saved Queries” page. In order to navigate to this page users may click the “Other” menu option from the top right and then, from the dropdown, select the “Saved Queries” option.
Once the users have selected the “Saved Queries” page. The following page will appear containing all the saved queries by the users.
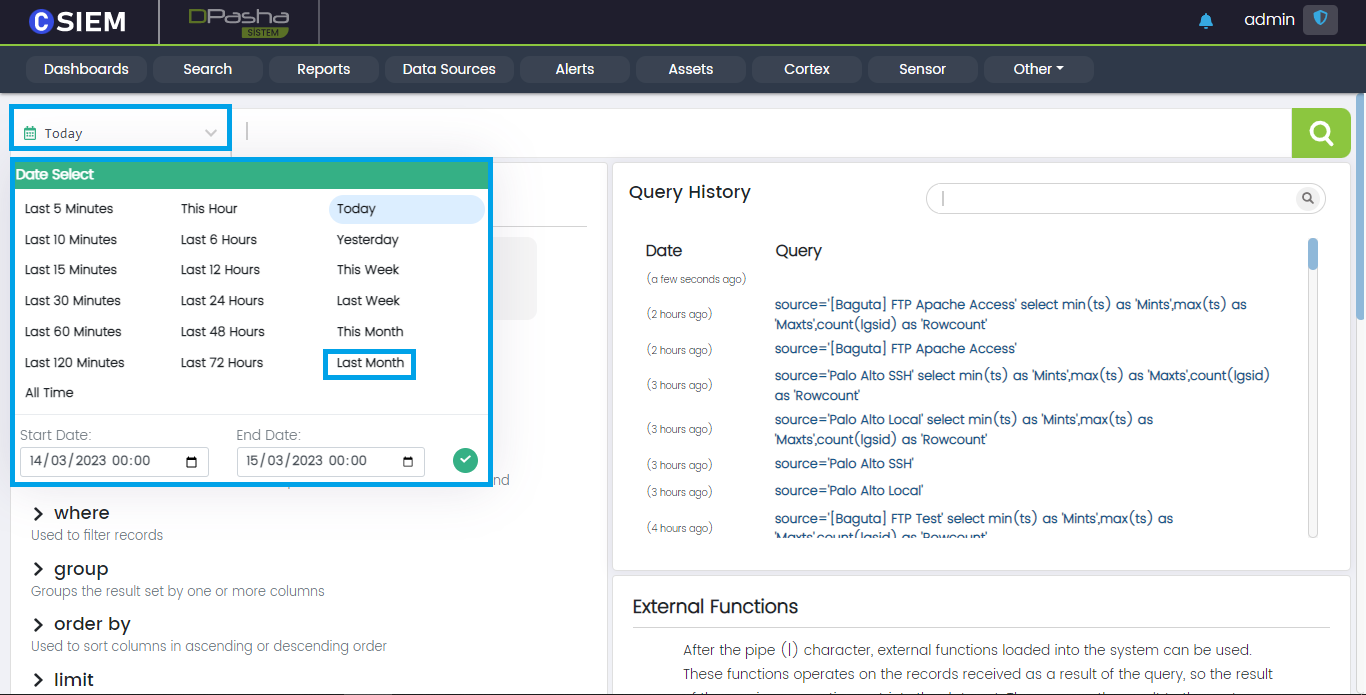
Search Timespan
This option allows users to select a date range, in order to get the search results of the specified time frame.
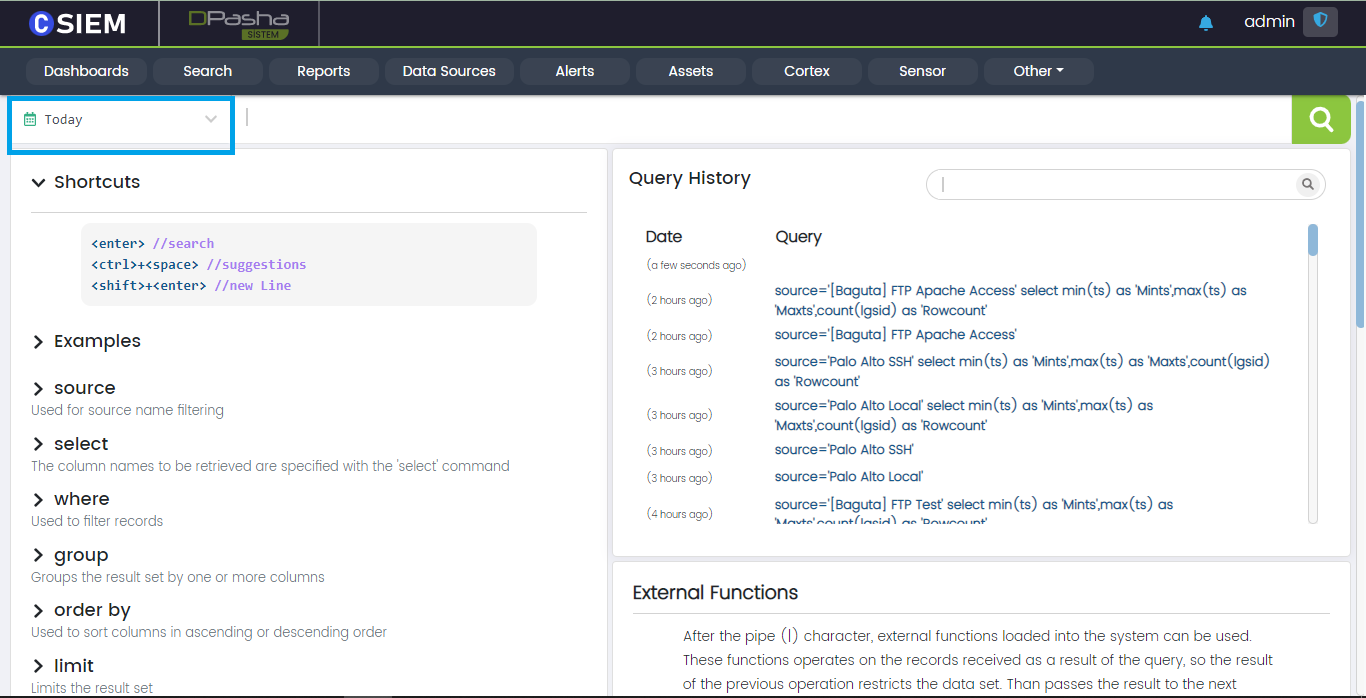
Timespan Example
Once the Time panel is clicked. A popup is shown which contains different timespan options. Users can also select from the date and time range menu as shown below:
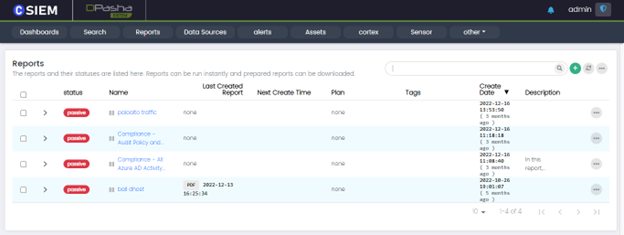
Reports
The reports and their statuses are listed here. Reports can be run instantly. Prepared reports can be downloaded.
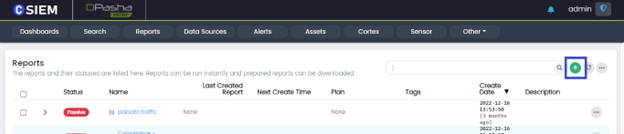
Add a Report
Users can add a report by clicking the “+” button at the top right as shown below:
Add Report Page
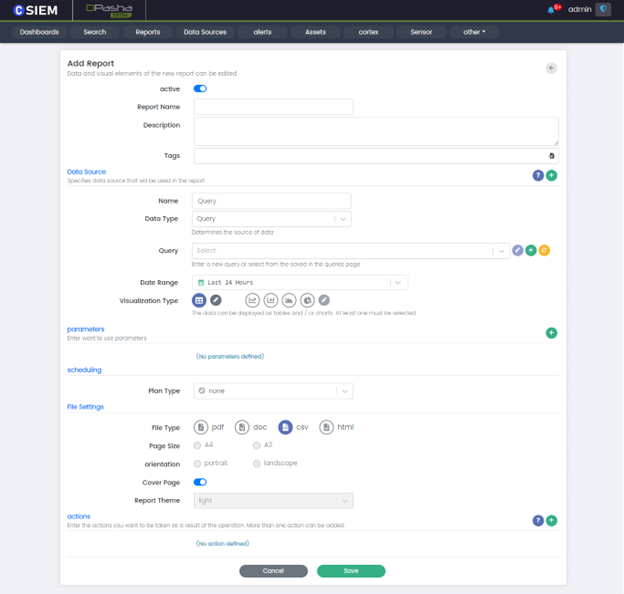
The different sections of the “Add Report” page are explained below.
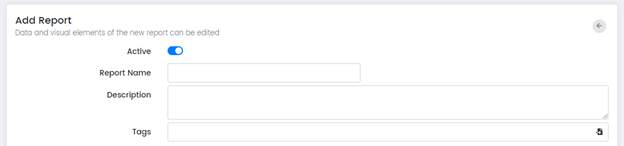
Report Name: Is the name of the reports regarding the contents.
Description: Optional clarification about the report.
Tags: Used to filter or search reports
Data Source
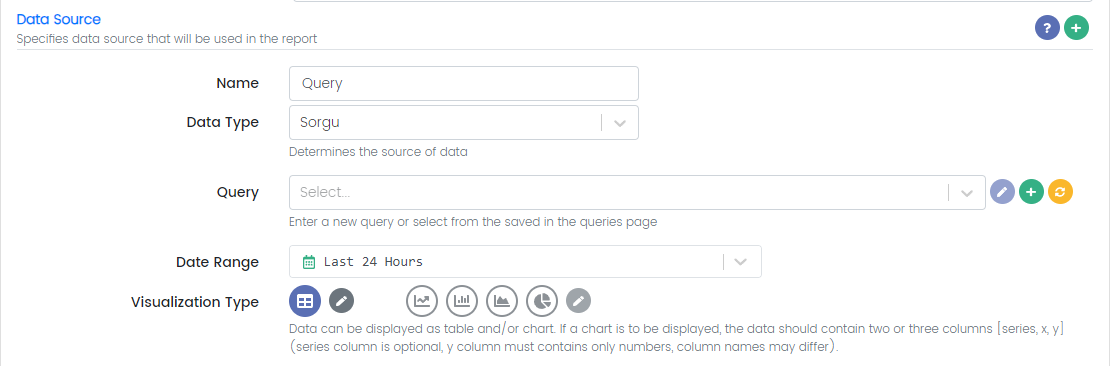
Name: is the name of the Data Source
Data Type: *
Query: The user can type a new query here or select one of the save queries.
Date Range: The user can specify the timespan for the data taken from the data source.
Visualization Type: Data can be displayed as tables and/or charts. At least one visualization type must be selected.
Schedule Report
The user can schedule report for One Time, Daily, Weekly, Monthly or Continuously for specific Timeframe.

Plan Type: One Time
Time: Time of the day when report will be generated
Date: Date on which the report to be generated

Plan Type: Daily
Time: Time of the day when report will be generated daily

Plan Type: Weekly
Time: Time of the day when report will be generated weekly
Day of week: Select the day of the week on which the report will be generated

Plan Type: Monthly (One Day)
Time: Time of the selected day of the month when report will be generated
Day of the month: Select a day of the month when report will be generated
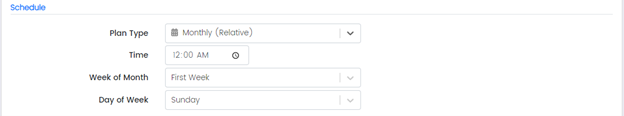
Plan Type: Monthly (Relative)
Time: Time of the selected day of the month at which the report will be generated
Week of Month: Select a week of the month when report will be generated
Day of Week: Select a day of the week on which report will be generated
Plan Type: Continuous
Time Type: Hour or Minutes
Time Value: Any value for the selected time type
File Settings
Report File settings section where the user can select file formats for exporting/creating reports.
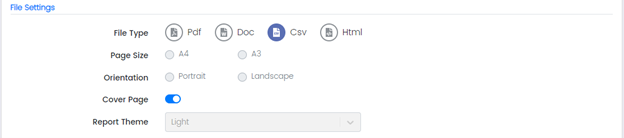
File Type: is the file type to which the report will be exported.
Available options are:
PDF (creates a report in pdf file format to be viewable on any type of hardware, software and OS).
DOC (Microsoft Document File refers to a word processing document format).
CSV (file is a text file that has a specific format which allows data to be saved in a table structured format.).
HTML (is a text-based approach to describing how content contained within an HTML file is structured).
Page Size: can be A4 or A3 (applies only to PDF or DOC File Formats).
Orientation: can be Portrait or Landscape (applies only to PDF or DOC File Formats).
Cover Page: allows the user to identify the objective of the document
Report Theme: Light is selected by default (This is the only option for now)
Actions
Enter the action that should be performed when the report is generated.
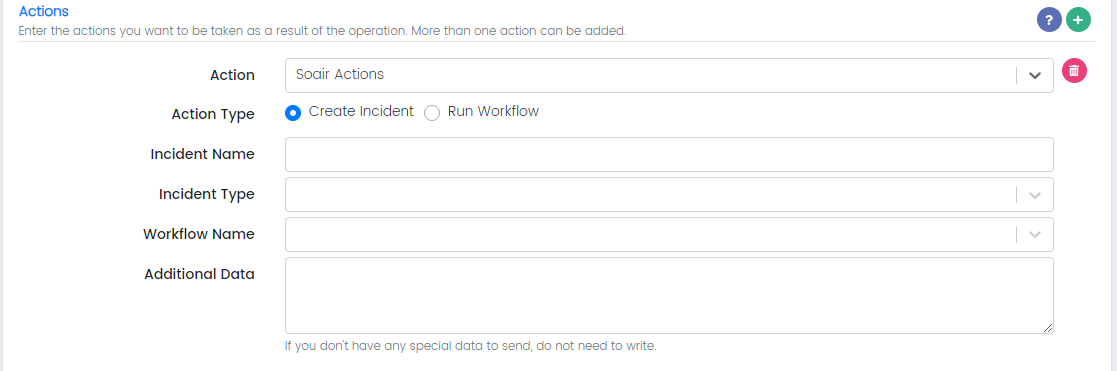

Add a new action by clicking this button denoted in the above screenshot.
Action: Create SOAIR Incident
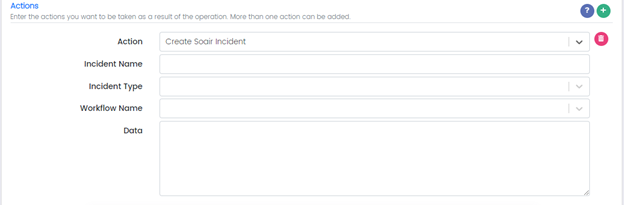
Incident Name: is the name of the incident
Incident Type:
Workflow Name:
Data:
Action: Run Python Script
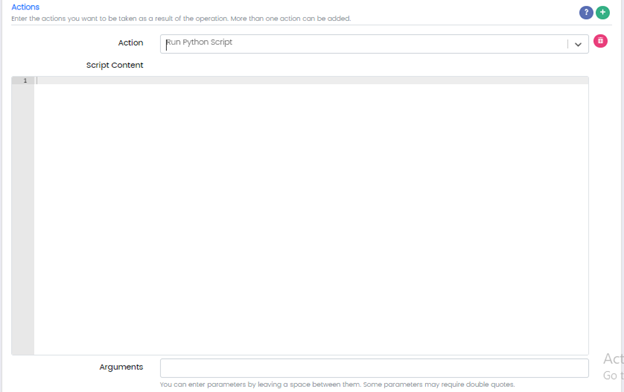
Script Content: Python Script
Arguments: Any parameters
Action: Send SMS
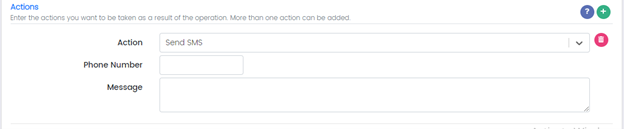
Phone Number: Add phone number
Message: Add message
Action: Send an Email
To: Email addresses of the recipients.
CC:
Bcc:
Subject:
Body:
Attachment:
Save or Cancel

Users can save the Report by clicking the Save button at the bottom of the report page.
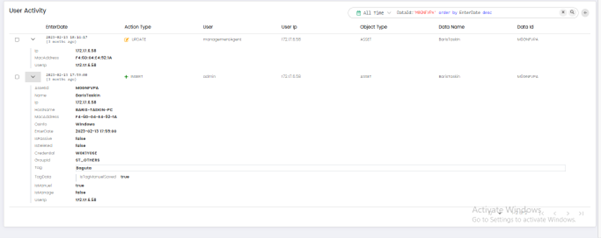
Alerts
With CSIEM’s alerts module, alerts for many distinct cases can be defined. The details of these cases and alerts are explained in this section. Which situations lead to creating alerts, the sending methods of the alerts and the settings will be explained under the “Alert Definition" section.
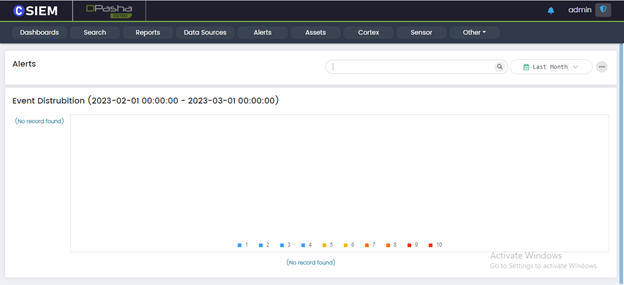
Search Alerts by Name or Tag
Select Time: Time of the Alert Generated
Alert Definitions
You can move to Alert Definitions Page by clicking the option button on top right corner of the Alerts page
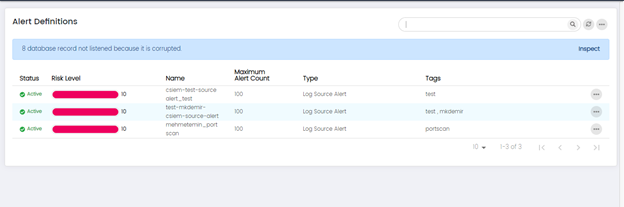
You can view, edit, disable, view details, upload to market and delete options on the previously saved Alert Definitions.
Add Alert Definition
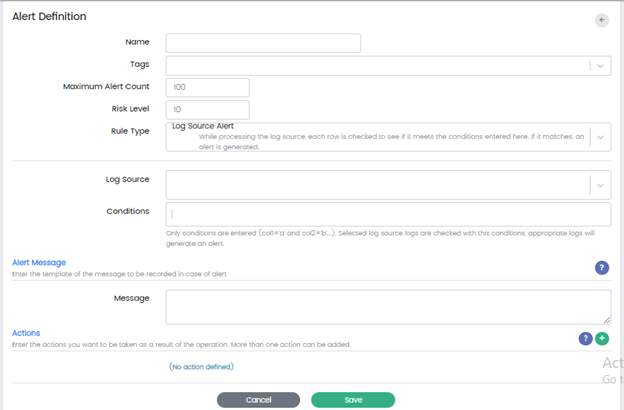
Alert definition Name: is the name of the alert.
Tags: are the tags through which you can easily search or filter alerts.
Maximum Alert Count: gives an upper limit the number of alerts that will be created.
Risk Level: Standardized
Rule Type: You can select 3 Types of rule Types
Log Source Alert – While processing the log source, each row is checked to see if it meets the conditions entered here, if it matches, an alert is generated.
Query – Creating Alerts by Indexed Search Queries
Query [ElastAlert] – Once logs are processed the query will run at the entered period and alerts will be generated if the conditions are met.
Log Source for Alert definition: Any log source can be added to process the logs like firewalls, switches, VPN etc.
Condition: are the rules through which the alerts are generated
Alert Message
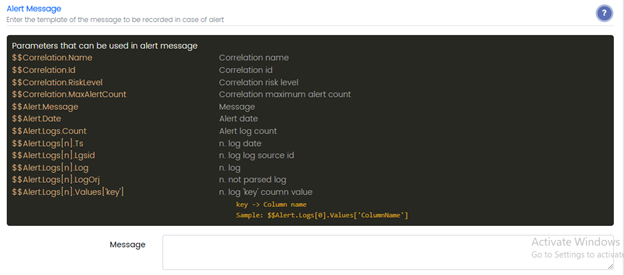
Message: Enter the message to be recorded in case of alert, parameters that can be used in an alert message can be seen by clicking question button in the blue.
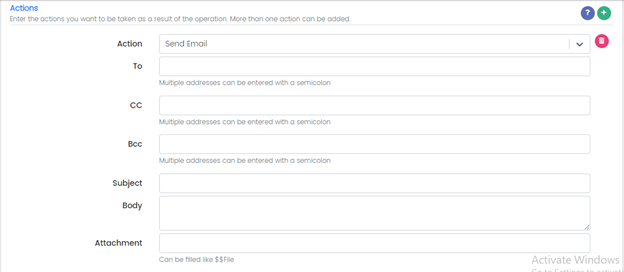
Actions
Add a new action from this button mentioned in the above picture
Action: Create SOAIR Incident

Incident Name:
Incident Type:
Workflow Name:
Data:
Action: Run Python Script

Script Content: Python Script
Arguments: Any parameters
Action: Send SMS

Phone Number: Add phone number
Message: Add message
Action: Send an Email

To: Email/s of the recipient
CC:
Bcc:
Subject:
Body:
Attachment:
Save or Cancel
![]()
Users can save the Alert by clicking the Save button at the bottom.
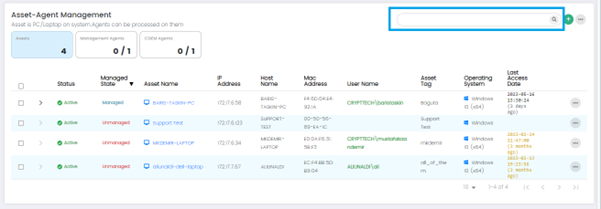
Assets
Asset-Agent Management Page is used to add and manage Agents & Assets. Agents are software components that are installed on endpoints such as servers, workstations, or network devices to collect and transmit security event data to the CSIEM. For details about Assets, please check Asset Management.
Users can go to the Asset-Agent Management page by clicking on Assets on the menu panel.
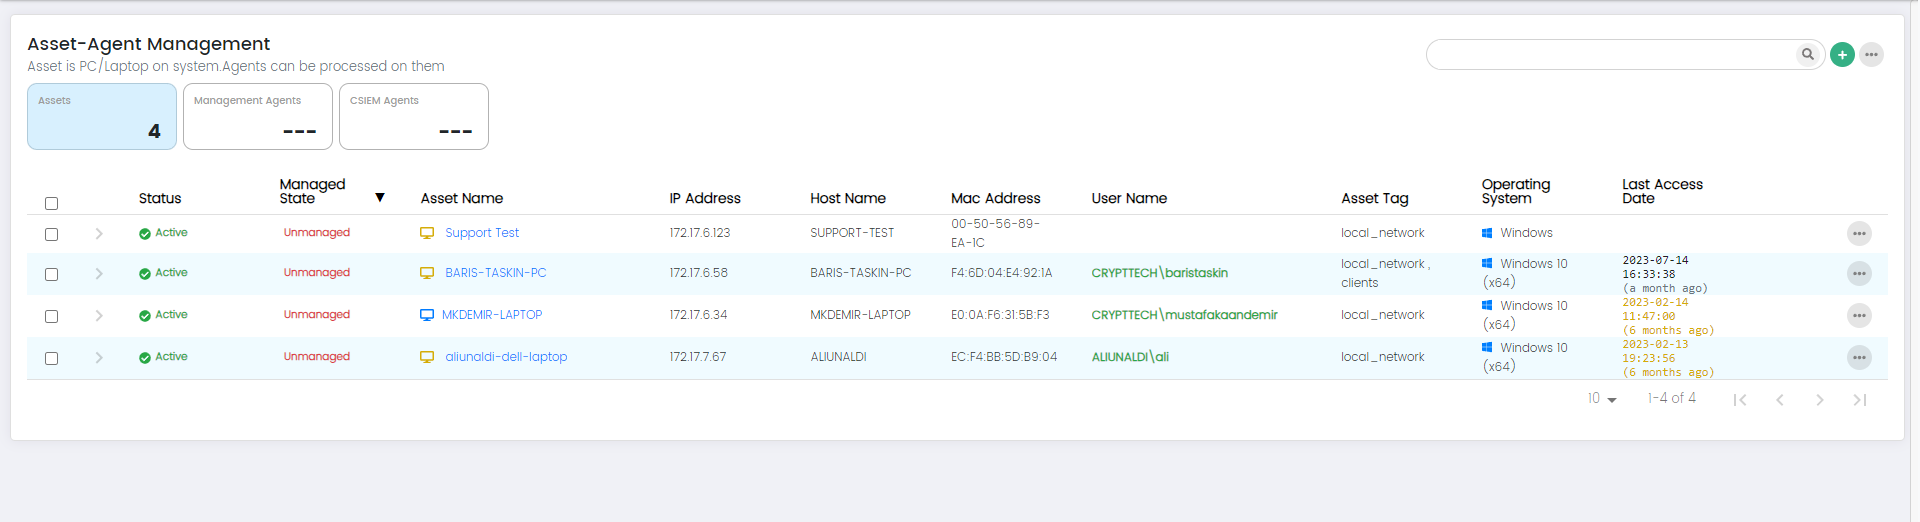
Columns on Asset –Agent Management Page: Assets Panel(default)
Status: This column indicates the status of the asset, which could include information like online, offline, active, inactive.
Managed State: The Managed State column shows whether the asset is actively being managed by the CSIEM system. It indicates if the asset is under monitoring and if the agent is properly connected and functioning.
Asset Name: This column displays the name or identifier assigned to the asset being monitored.
IP Address: The IP Address column shows the unique network address assigned to the asset.
Hostname: This column displays the hostname associated with the asset.
MAC Address: The MAC Address column shows the Media Access Control (MAC) address of the asset's network interface.
Username: This column displays the username associated with the asset.
Asset Tag: The Asset Tag column shows any specific tags or labels assigned to the asset. Asset tagging allows users to categorize and group assets based on various criteria, facilitating easier asset management.
Operating System: This column indicates the operating system installed on the asset.
Last Access Date: The Last Access Date column displays the date and time when the asset or agent was last accessed or communicated with the CSIEM system.
Management Agents
Users can see all the Assets which have Management Agents installed by clicking on the Management Agents widget.
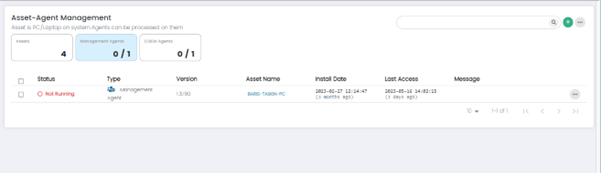
Management agents are responsible for collecting and forwarding security event data from various sources to the central CSIEM server. They act as intermediaries between data sources (network devices, security devices, etc.) and the CSIEM system.
0/1 means that 0 management agents are active out of 1.
Columns on Asset-Agent Management Page: Management Agents Panel
Status: This column displays the status of the Asset Agent. It indicates whether the agent is running or not running.
Type: This column indicates the type of agent whether it is Management Agent or CSIEM Agent.
Version: This column shows the version number of the Agent software installed on the asset. It helps Users track the software versions across their network, ensuring that all agents are up to date and running the latest software releases.
Asset Name: This column displays the name or identifier of asset associated with the Agent. It provides a clear reference to the individual assets within the network.
Install Date: This column shows the date when the Agent was initially installed on the asset. It provides Users with information about the deployment timeline, enabling them to track and manage the lifecycle of agent.
Last Access: This column indicates the date and time when the Asset Agent last communicated with the CSIEM system.
Message: This column displays relevant messages or notifications related to the Agent or associated assets.
CSIEM Agents
Users can see all the Assets which have CSIEM Agents Installed by clicking on the CSIEM Agents widget.
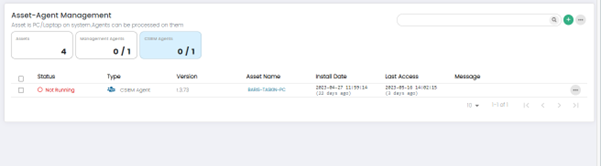
Purpose: CSIEM agents are installed on individual endpoints (servers, workstations) within the IT infrastructure.
Function: They gather endpoint-specific information and facilitate real-time monitoring, analysis, and response capabilities.
0/1 means that 0 CSIEM agents are active out of 1.
Columns on Asset-Agent Management Page: CSIEM Agents Panel
Status: This column displays the status of the Asset Agent. It indicates whether the agent is running or not running.
Type: This column indicates the type of agent whether it is Management Agent or CSIEM Agent.
Version: This column shows the version number of the Agent software installed on the asset. It helps Users track the software versions across their network, ensuring that all agents are up to date and running the latest software releases.
Asset Name: This column displays the name or identifier of asset associated with the Agent. It provides a clear reference to the individual assets within the network.
Install Date: This column shows the date when the Agent was initially installed on the asset. It provides Users with information about the deployment timeline, enabling them to track and manage the lifecycle of agent.
Last Access: This column indicates the date and time when the Asset Agent last communicated with the CSIEM system.
Message: This column displays relevant messages or notifications related to the Agent or associated assets.
Assets Search
Users can search Assets from the search bar.
Assets Options
The User can see further options on the Asset-Agent Management Page by clicking on the (...) button.
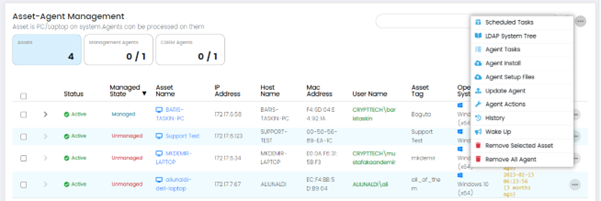
Scheduled Tasks: This option allows Users to schedule tasks to run automatically on selected assets.
LDAP System Tree: This option provides access to the LDAP (Lightweight Directory Access Protocol) system tree, which is a hierarchical directory structure used for storing and organizing information about network resources, including user accounts and assets. Users can use this feature to manage and synchronize assets within the CSIEM system with the LDAP directory.
Agent Tasks: This option allows Users to manage and configure the tasks that are performed by agents.
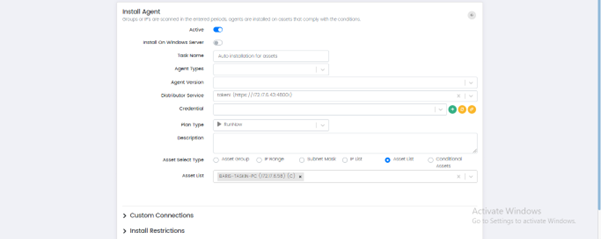
Agent Install: This option allows Users to install agents on selected assets.
Update Agent: This option allows Users to update the agents that are installed on assets.
Agent Actions: This option allows Users to perform actions on selected agents.
History: This option displays a history of events related to the selected asset or agent.
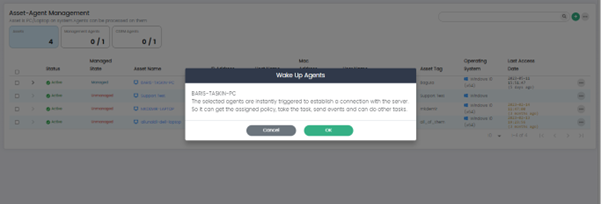
Wake Up: This option sends a wake-up call to the selected asset.
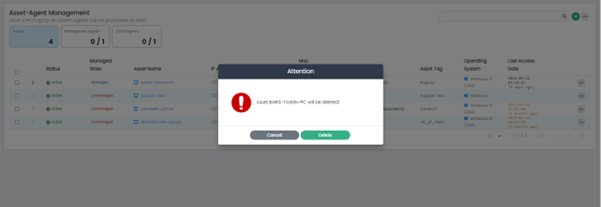
Remove Selected Asset: This option removes the selected asset from the CSIEM system.
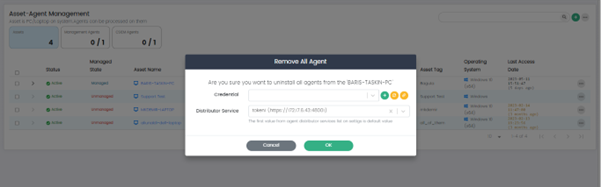
Remove All Agents: This option removes all agents that are installed on the selected asset.
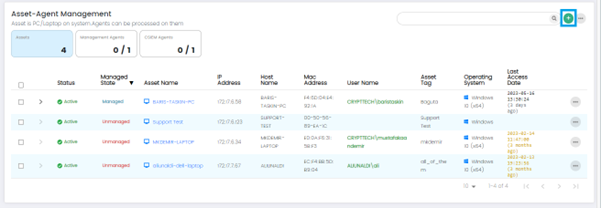
Add New Asset
The option allows Users to add a new Asset by clicking on the (+).
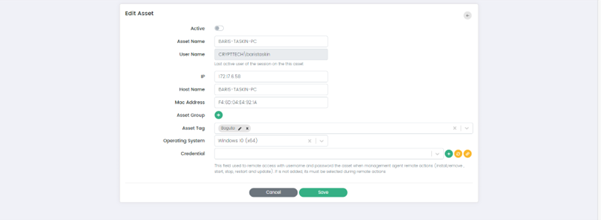
Add Asset Page
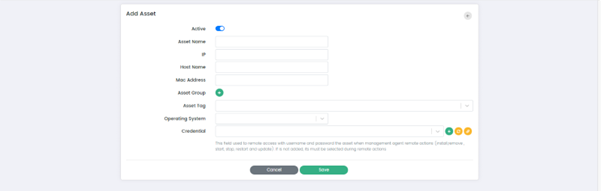
Add Asset Page has the following fields:
Active: When the "Active" option is checked, it indicates that the asset is active and being monitored. Conversely, when the "Active" option is unchecked, it indicates that the asset is inactive and not being monitored by the system.
Asset name: This field allows Users to assign a name to the asset.
IP: This field allows Users to specify the IP address associated with the asset.
Host Name: This field allows Users to specify the host name associated with the asset.
Mac Address: This field allows Users to specify the MAC address associated with the asset.
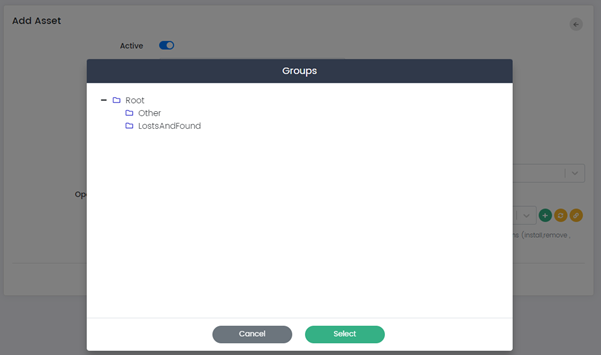
Asset Group: This option allows Users to assign the assets to a specific group. Users can select Asset Group by clicking on the (+) button.
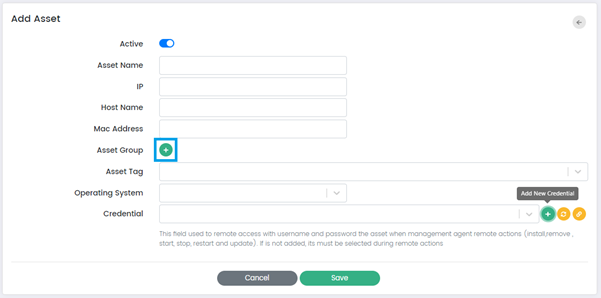
Asset Tag: This field allows Users to assign a tag to the asset. Users can add new tag by typing into the field or select a previously used tag.
Operating System: This field allows Users to specify the operating system running on the asset. Users can choose the operating system from the dropdown.
Credential: This option allows Users to specify the credentials that are required to access and monitor the selected asset.
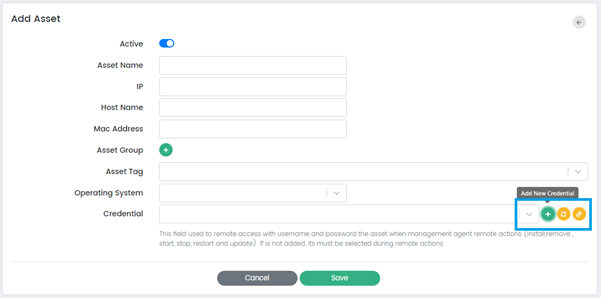
There are three buttons along the Credential Field:
Add New Credential: This button allows Users to add new credentials or authentication information for accessing and managing the asset. When clicked, it prompts the user to the Create New Credential Page which is explained in the Credential Management Section of this document.
Adding credentials enables the CSIEM system to authenticate and establish a secure connection with the asset for monitoring and management purposes.
Refresh Credential: This button triggers a refresh of the existing credentials associated with the asset. When clicked, it updates the stored credential information, ensuring that the CSIEM system uses the most up-to-date authentication details when connecting to the asset. This option is useful when there are changes or updates to the credentials, such as password changes or credential expiration.
Connection Test: This button allows Users to test the connectivity and authentication of the provided credentials against the asset. When clicked, the CSIEM system attempts to establish a connection using the specified credentials. The test connection functionality verifies whether the credentials are valid and whether the CSIEM system can successfully connect to the asset.
Cancel or Save: These buttons allow Users to cancel the asset creation process or save the asset configuration and add it to the CSIEM system.
Asset Options
The user can see further options on each of the Assets separately by clicking on the (…) Options button for a specific Asset.
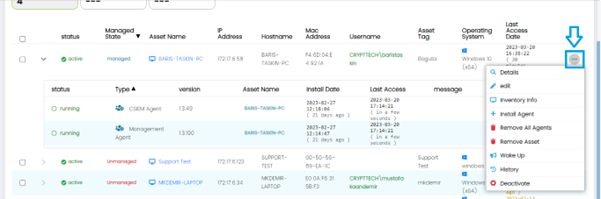
These Options are:
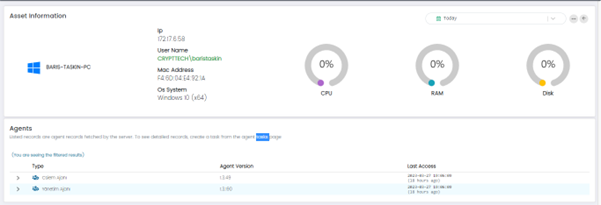
Details: This option provides information about the selected asset, such as IP address, MAC address, hostname, and operating system.
Edit: This option allows Users to modify the details of an asset.
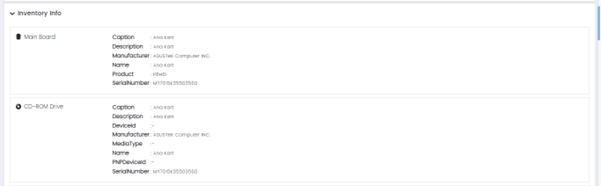
Inventory Info: This option provides a detailed inventory of the selected assets, including installed software and hardware components.
This Page has Three Panels:
Asset Inventory and system info:

Inventory Info:
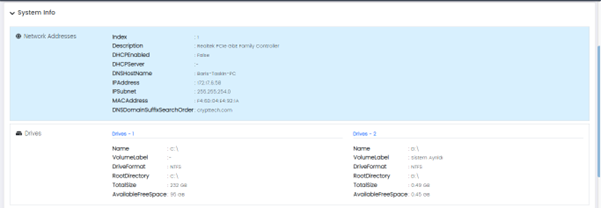
System Info:
Install Agent: This option is used to install agents on the selected asset.
Remove All Agents: This option removes all agents installed on the selected asset.
Remove Asset: This option removes the selected asset.
Wake Up: This option sends a wake-up call to the selected asset.
History: This option displays a history of events related to the selected asset.
Deactivate: This option deactivates the selected asset.
Asset Details
The user can see the installed Agents on an Asset by clicking on the drop-down Arrow button.
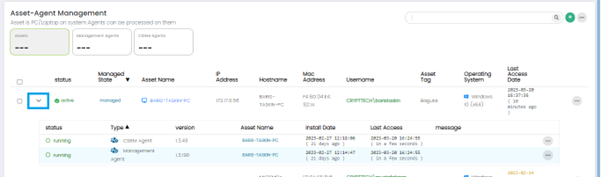
CSIEM Agent Options
For CSIEM agent in the list, the following options are available: Start, Stop, Restart, Remove, Update, and Get Logs.
These options are displayed by clicking the Options button (...) at the right side of each row in the list.
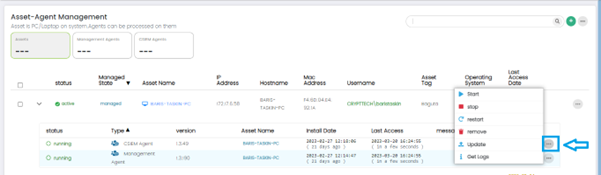
Start: This option starts the selected agent if it is not currently running.
Stop: This option stops the selected agent if it is currently running.
Restart: This option stops and then starts the selected agent to refresh its configuration or to troubleshoot any issues that it may be experiencing.
Remove: This option removes the selected agent from the asset that it is installed on.
Update: This option updates the selected agent to the latest version.
Get Logs: This option retrieves the log files generated by the selected agent.
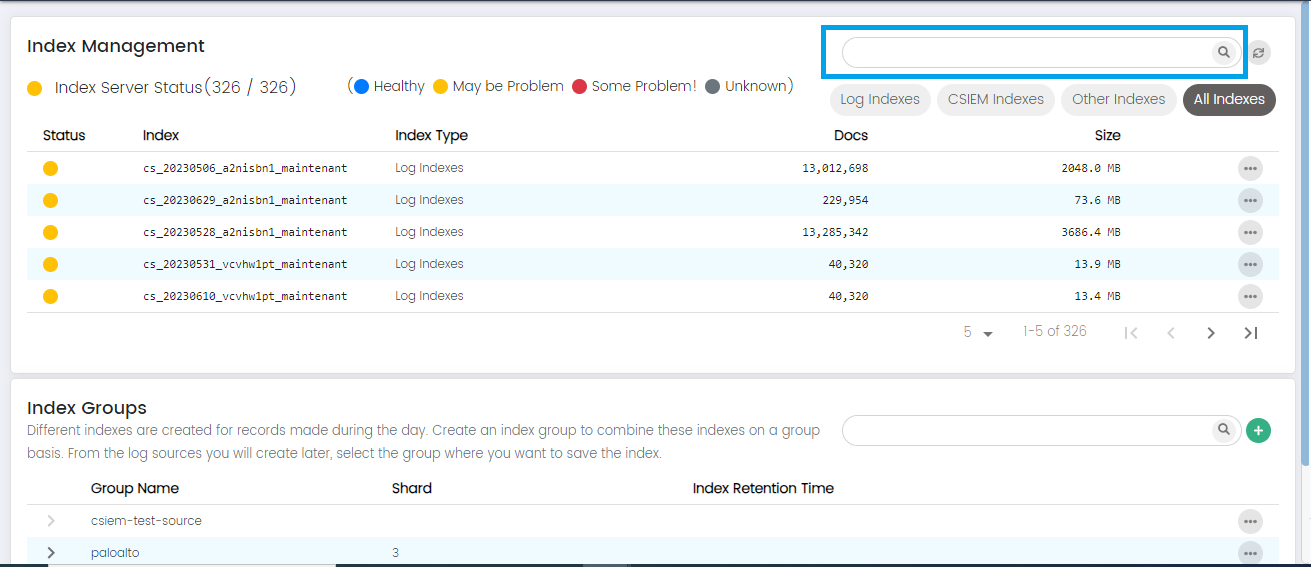
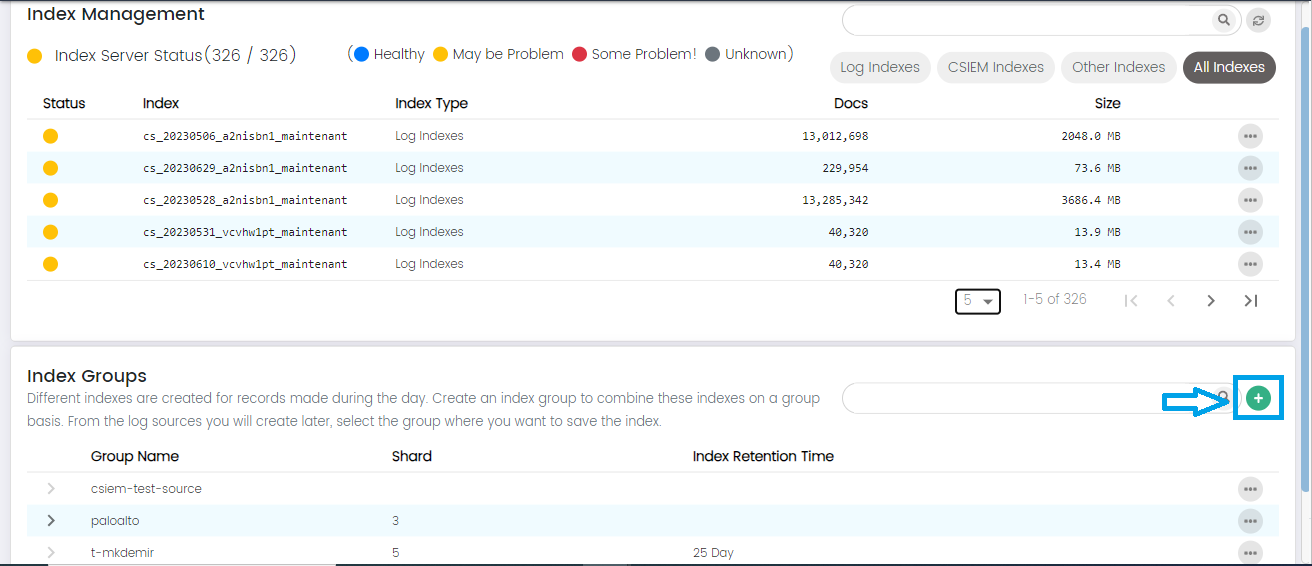
Index Management
Index Management page of CSIEM, you'll find a comprehensive set of informative columns and additional fields that provide essential details about the data indexes used for storing and managing your security and event data.
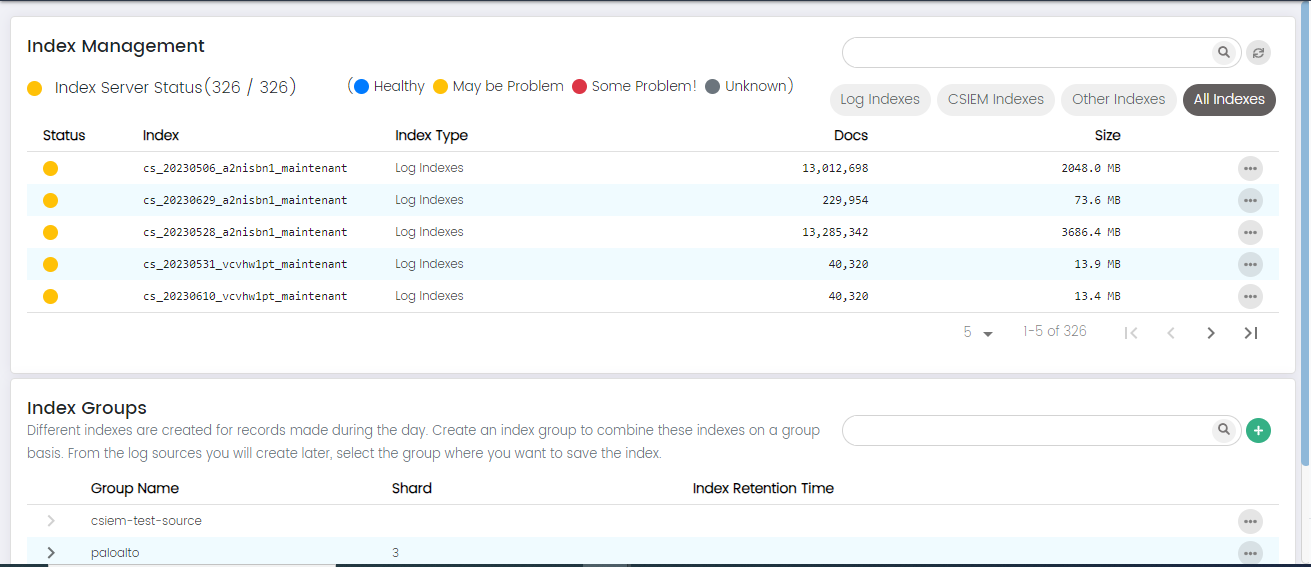
Index Management Page Columns:
Status: The "Status" column indicates the operational state of the index, providing insights into its health and functionality. The possible status values include:
Healthy: This status indicates that the index is operating optimally and is free from any known issues.
May Have Problem: The "May Have Problem" status suggests that there could be potential issues or anomalies with the index that require further investigation. While the index is operational, there might be indications of irregularities or performance deviations that warrant attention.
Some Problem: This status implies that the index is currently experiencing certain problems that need to be addressed.
Unknown: The "Unknown" status signifies that there is insufficient or ambiguous information available to determine the index's current state.
Index: The "Index" column displays the unique identifier or name assigned to a specific data index.
Index Type: The "Index Type" column categorizes or classifies the type of data being stored within the index. This helps users quickly understand the purpose or source of the data contained in each index. For example, index types could include "Security Logs," "Application Logs," "Network Traffic," and more.
Source Name: The "Source Name" column shows the name or identifier of the data source that contributes to the respective index. This helps identify the origin of the data, whether it's generated by a particular application, system, device, or network component.
Docs: The "Docs" (Documents) column displays the total number of individual documents or log entries stored within the index. This metric gives an idea of the volume of data contained in each index, helping users assess the data's significance and potential for analysis.
Size: The "Size" column indicates the storage space occupied by the index on the underlying storage infrastructure. It provides information about the amount of disk space consumed by the data within the index. Monitoring the size is crucial for capacity planning and resource allocation.
Search: The "Search" option on the Index Management page enhances your ability to locate specific indexes within CSIEM efficiently.
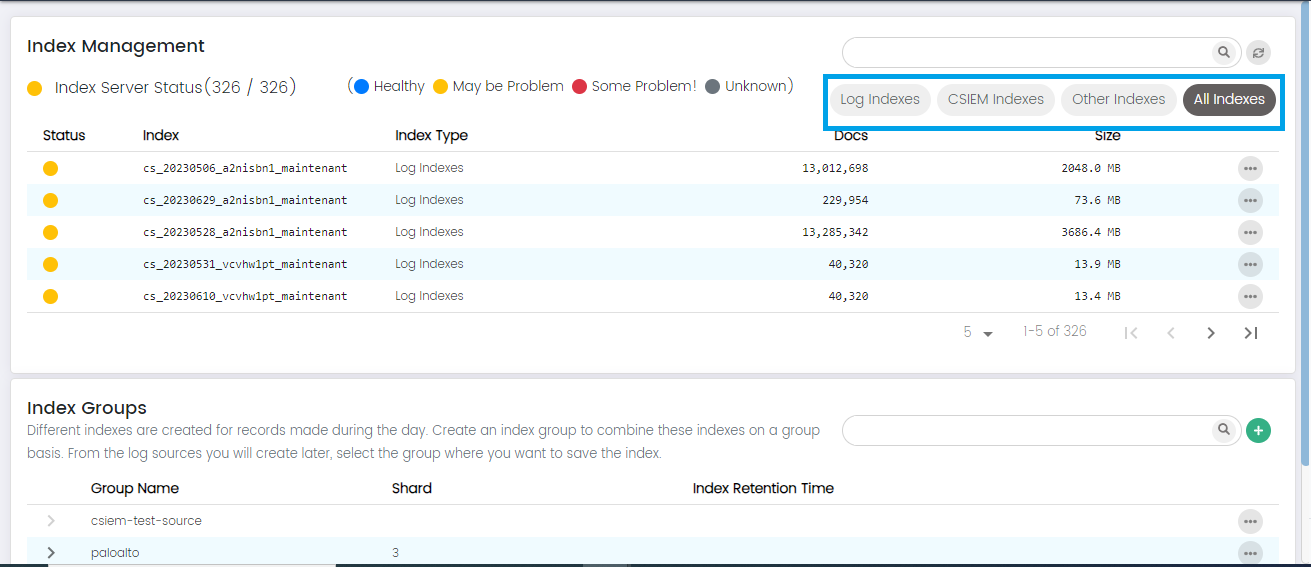
Index Type Filter Buttons: The "Index Type Filter Buttons" enhance your ability to categorize and quickly access specific types of indexes within your CSIEM.
Indexes can be filtered as log indexes, CSIEM indexes, other indexes and all indexes.
Index Management: More Options
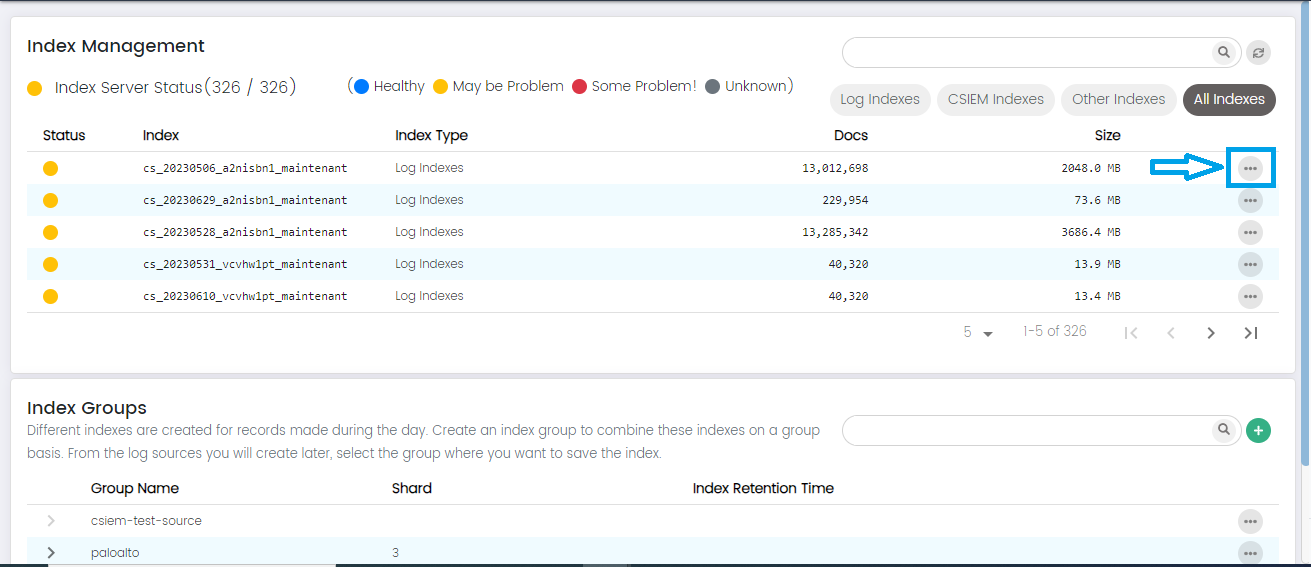
User can see more options on each index in the list, these options are:
Index Status: This option provides detailed status information about the index, such as the health of its shards, replication status, and any potential issues affecting its performance.
Index Metadata: This option presents additional metadata or attributes associated with the index, such as creation date, retention policy, and data source details.
Index Groups
The "Index Groups" in CSIEM displays a list of the existing index groups, allowing you to add, edit and delete index groups.
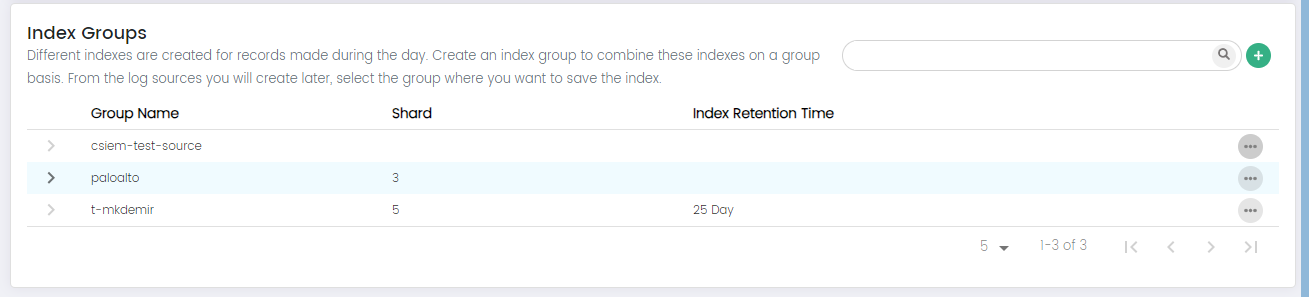
Here are the columns available on this page:
Group Name: The "Group Name" field allows you to specify a descriptive name for the new index group.
Shard: The "Shard" field allows you to set the default number of smaller units, or shards, that the indexes within this group will be divided into.
Index Retention Time: The "Index Retention Time" field lets you define the default retention period for data stored within the indexes of this group. This parameter specifies how long data will be retained before it is automatically removed or archived. Setting a retention time helps manage data lifecycle, storage usage, and compliance requirements for the indexes within this group.
Add Index Groups
The "Add Index Group" page in CSIEM enables you to create and define new index groups, which serve as logical containers for organizing and managing related data indexes.
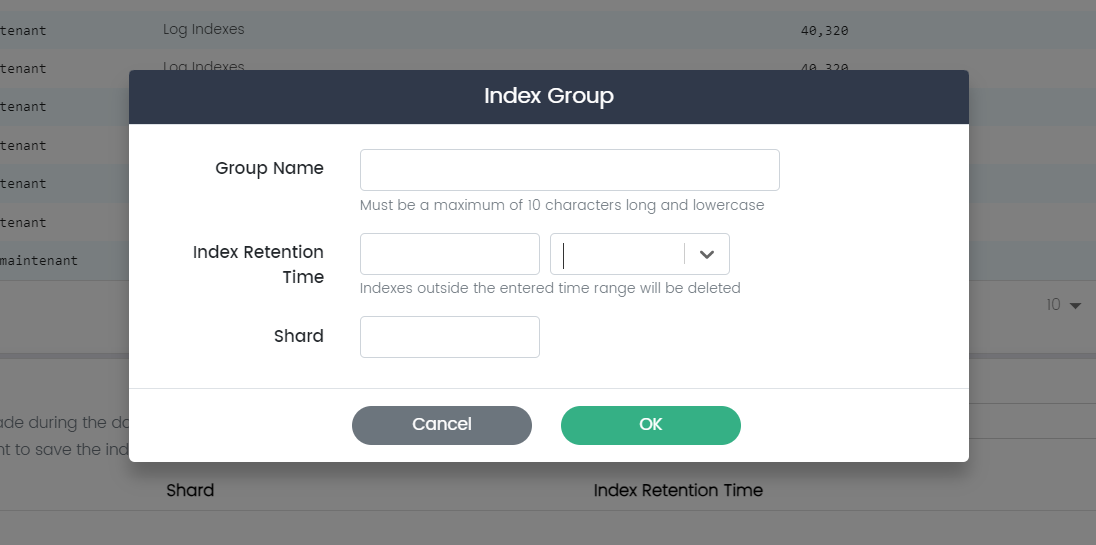
Here are the fields available on this page:
Group Name: The "Group Name" field allows you to specify a descriptive name for the new index group.
Shard: The "Shard" field allows you to set the default number of smaller units, or shards, that the indexes within this group will be divided into.
Index Retention Time: The "Index Retention Time" field lets you define the default retention period for data stored within the indexes of this group. This parameter specifies how long data will be retained before it is automatically removed or archived. Setting a retention time helps manage data lifecycle, storage usage, and compliance requirements for the indexes within this group.
Index Groups: More Options
In the "More Options", you have the following actions available for each index group:
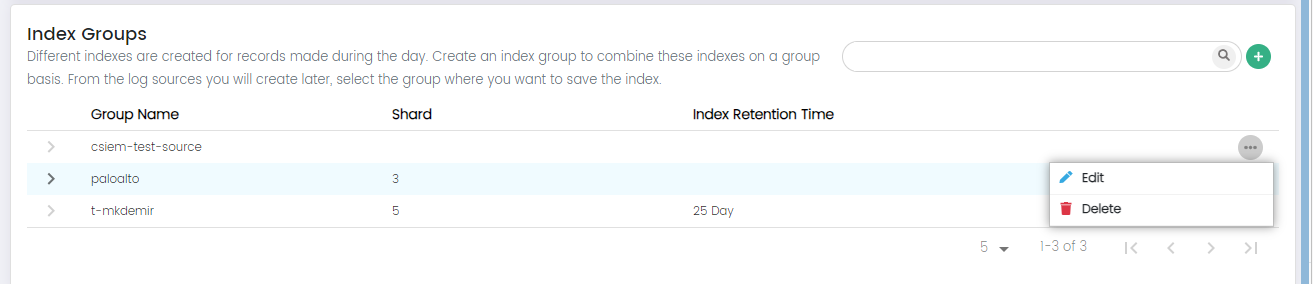
Edit:
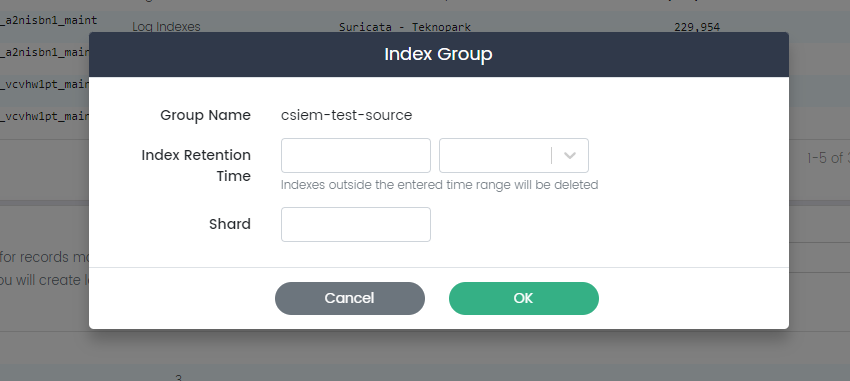
The "Edit" option allows you to modify the configuration of an existing index group. You can adjust settings such as shard configuration and index retention time.
Delete:
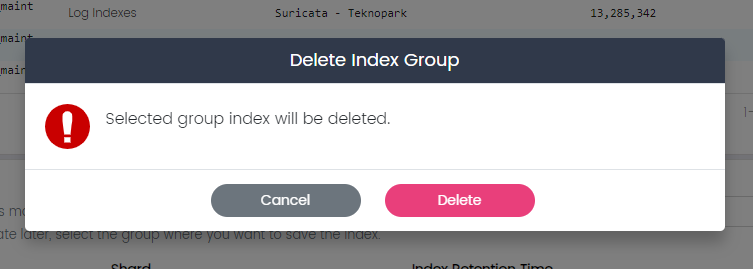
The "Delete" option enables you to remove an index group that is no longer required.
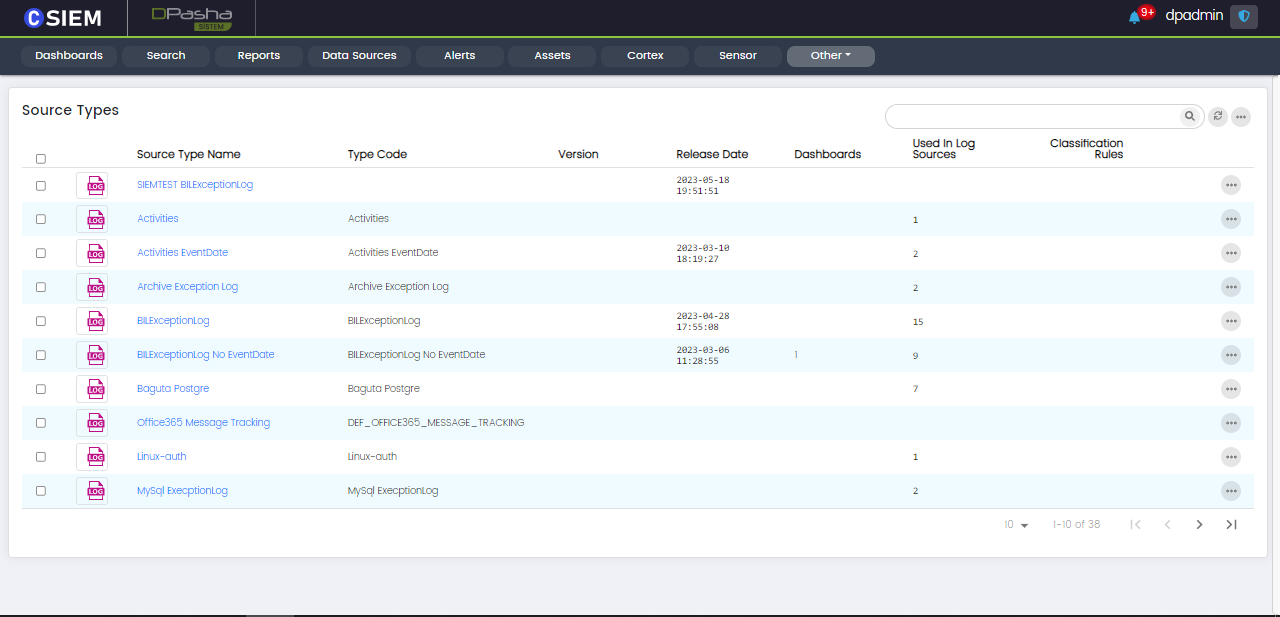
Source Types
The CSIEM platform has some predefined source types for parsing the logs collected from different sources such as Apache Server, CryptoSpot Traffic, etc.
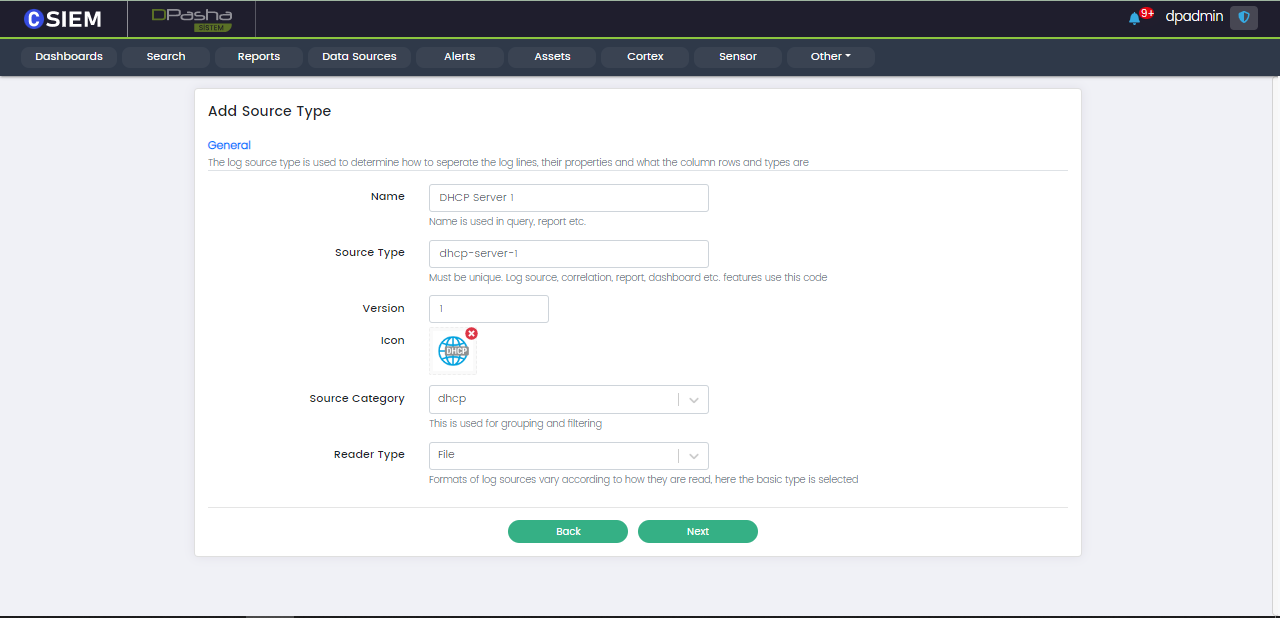
Add Source Type
Users can add new source type, the users need to input the following details.
- Name (title for the source type)
- Source Type (unique name)
- Version
- Icon (upload any image)
- Source Category (dhcp, dns, firewall, etc.)
- Reader Type (the file that the source read the data from)
An example is given below.
Once the user has entered the required data and selected the required options. Click the Next button at the bottom to move on to the next part. The next page is show below.
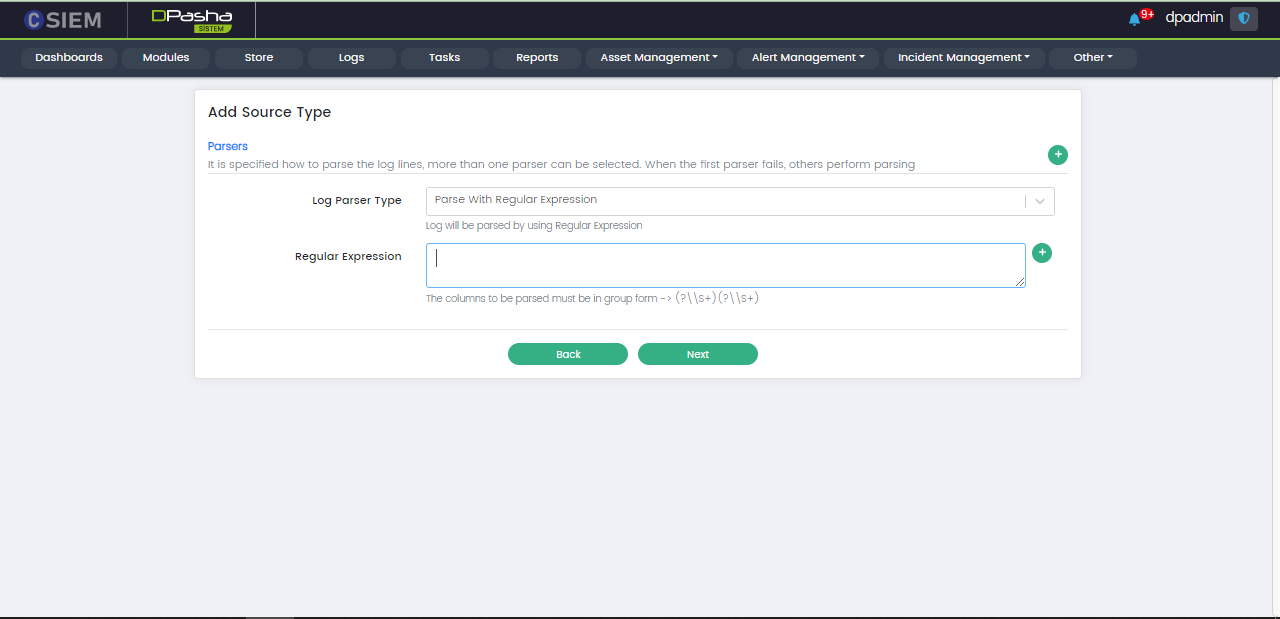
Select Log Parser Type
The user needs to choose the Log Parser Type for the Log Source Type. This parser will be applied to all the data coming from the respective source in this source type. Parsers are used to extract valuable information from the logs. At the end click the Next button at the bottom.
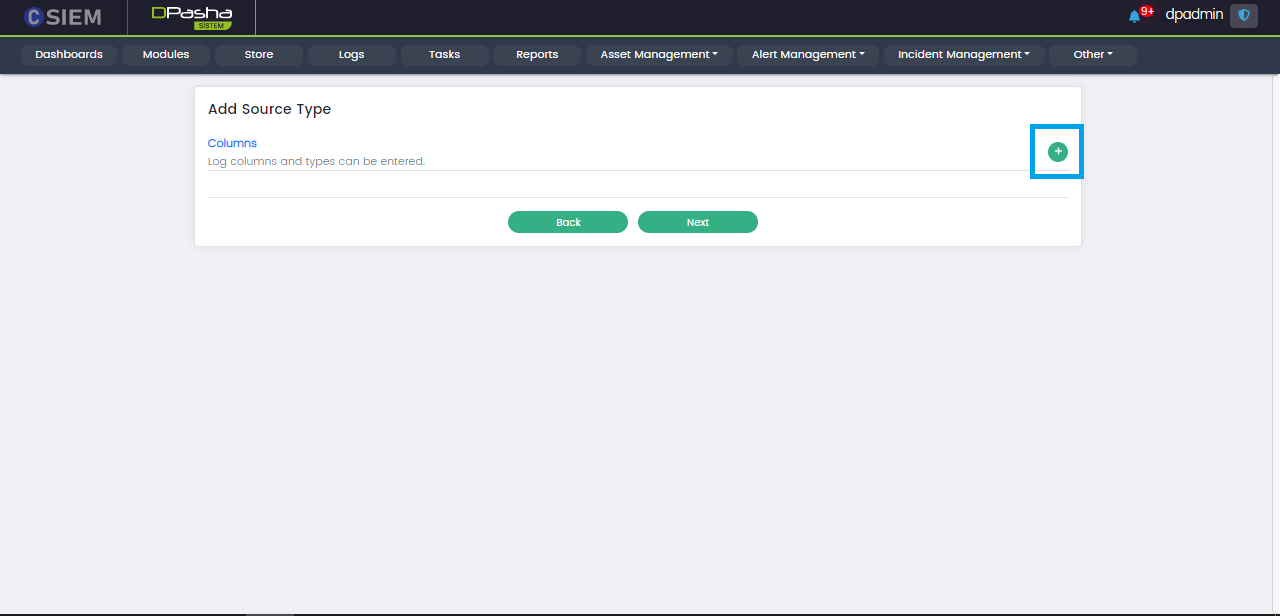
Add Columns
The user can select the columns to be extracted from the logs (using the Log Parser.) Users can add these columns by clicking the (+) button on the top right as shown in the figure below.
The columns are based on type of data such as Strings, Boolean, Number, Date, IP, and Geo_Point.
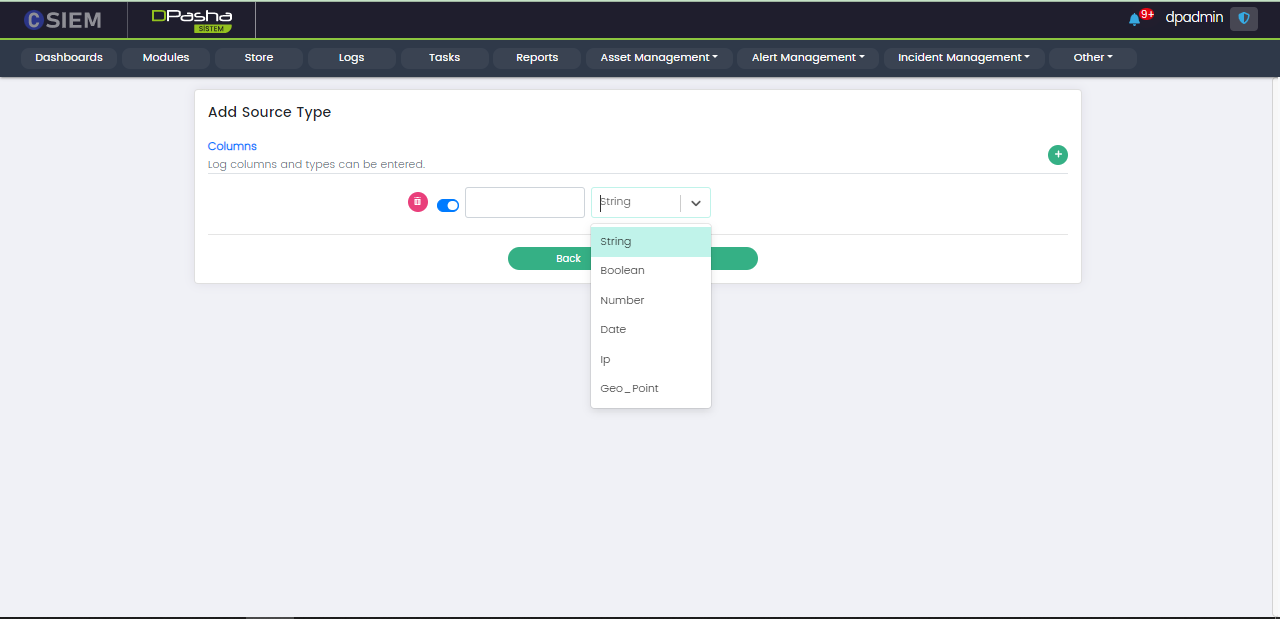
Users can create/add different columns. These columns can be made active and inactive using the toggle button on the left side of each of the column items. Users can also delete the columns using the red button on the left side of each of the column items.
An example of the columns for the Log Source Type is given below.
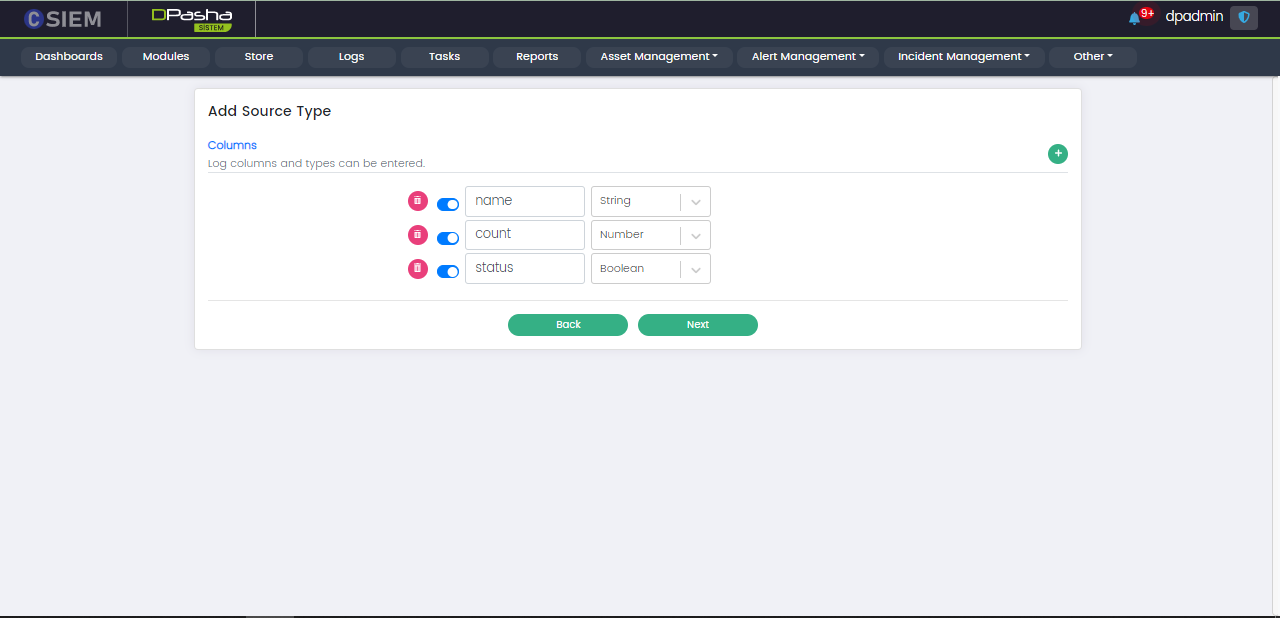
Once user has created/added the required columns. User can click the Next button at the bottom to proceed to creating the Source Type.
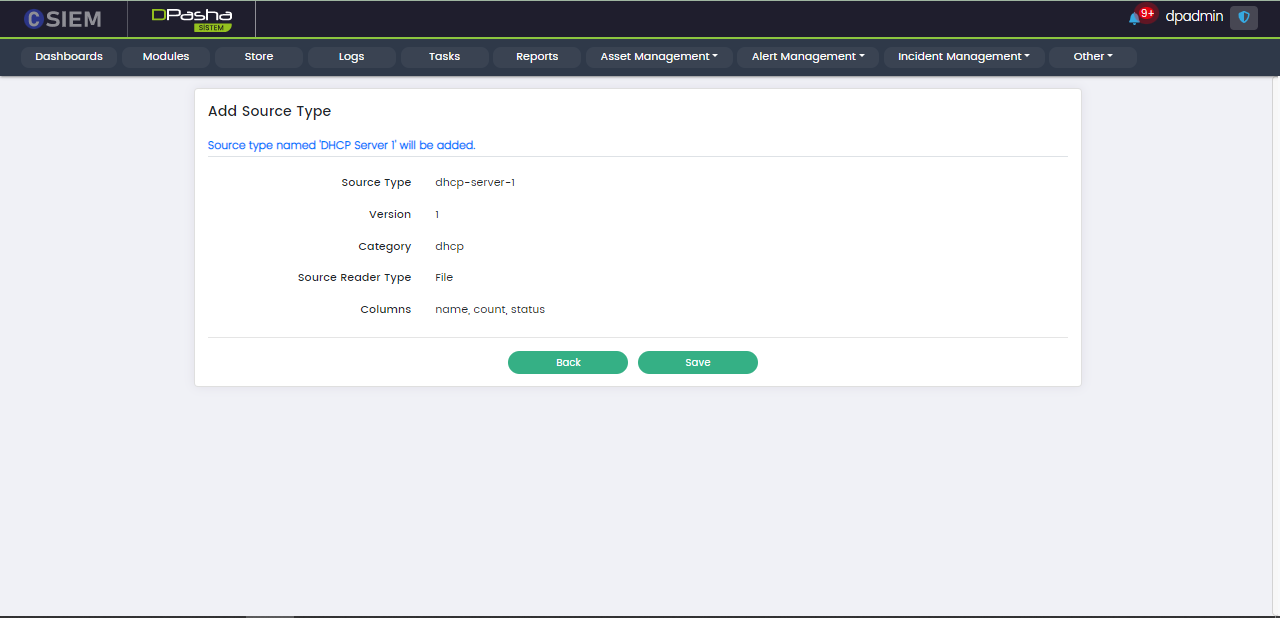
Save Source Type
This is the last step in the creation of the Source Type. Once all the details are added, user can click the Save button at the bottom. This will create the new Source Type.
Classification
The "Classification Definition" page provides a comprehensive overview of different classifications that you can assign to events or incidents for effective categorization and analysis.
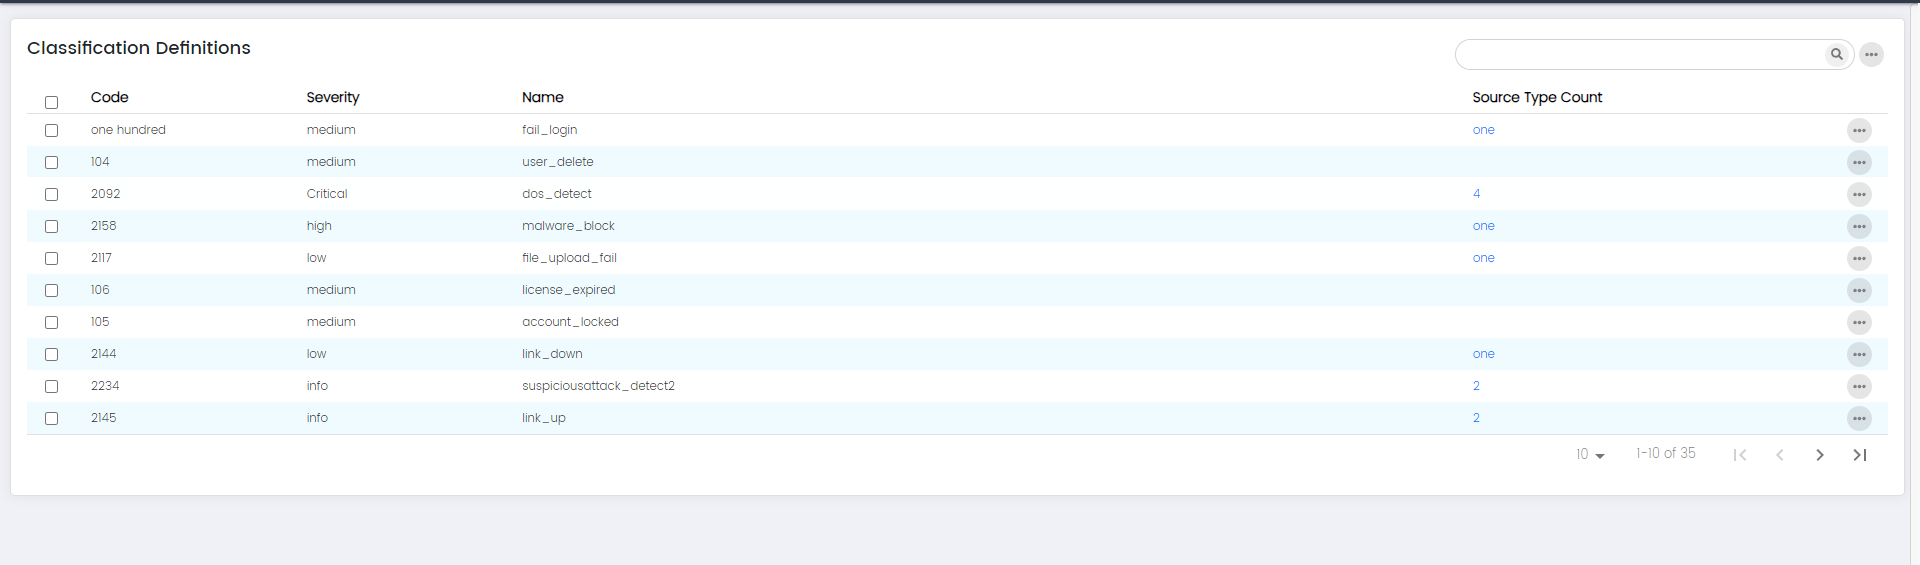
Classification: Columns
Selection Radio button:
The "Selection Radio button" column includes radio buttons next to each classification definition, allowing users to select or choose specific classifications.
Code:
The "Code" column displays a unique identifier or code assigned to each classification definition.
Severity:
The "Severity" column indicates the level of severity associated with each classification definition.
Name:
The "Name" column presents the descriptive name of each classification definition.
Source Type Count:
The "Source Type Count" column displays the number of source types associated with each classification definition.
Classification: More Options
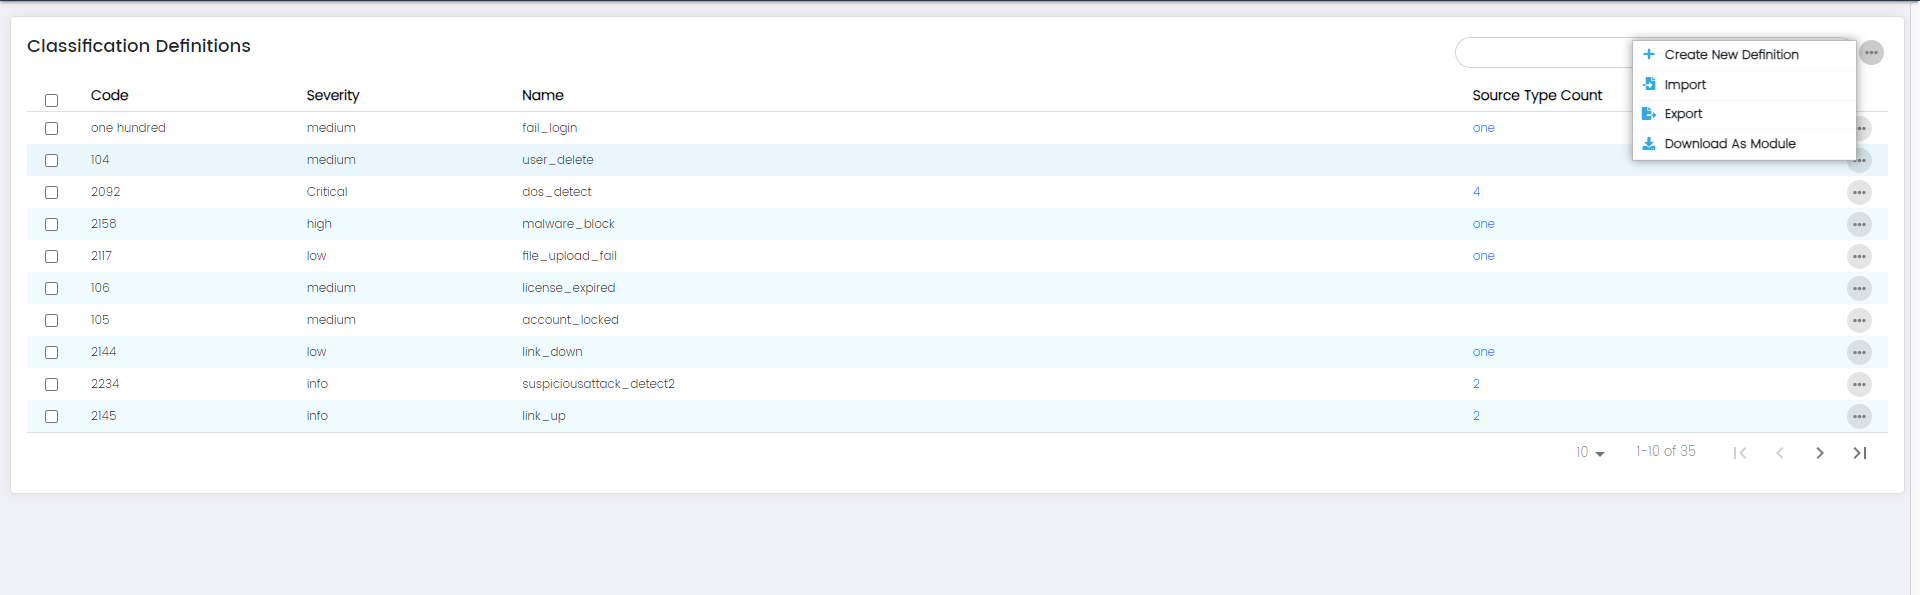
- Create New Classification Definition
- Import
- Export
- Download as module
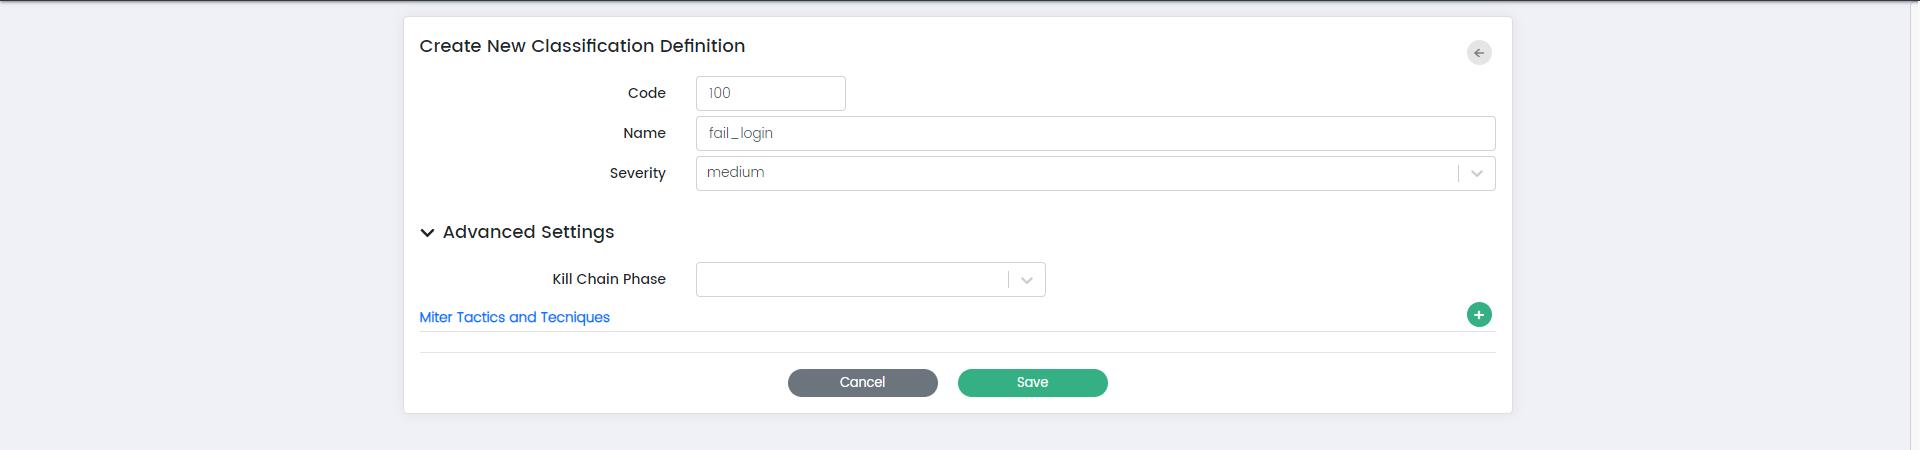
Create new Classification Definition:
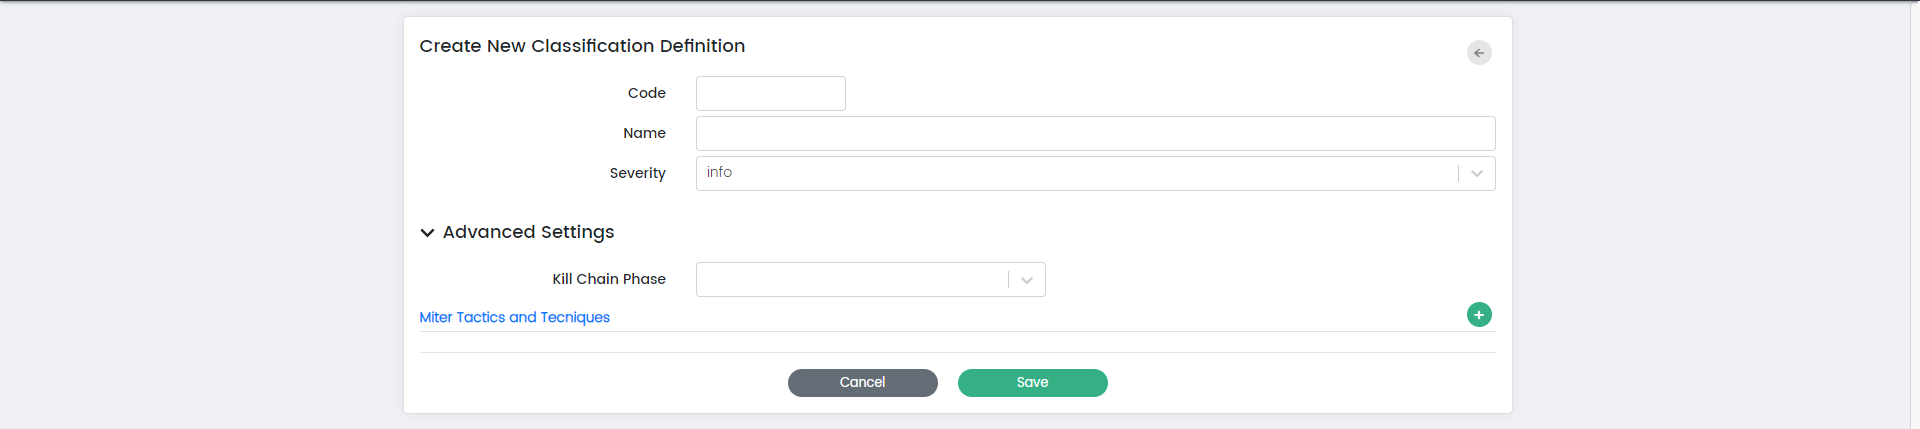
Here is the overview of the fields on this page:
Code:
The "Code" field allows you to assign a unique identifier to the classification definition.
Name:
The "Name" field enables you to provide a descriptive name for the classification definition.
Severity:
The "Severity" field lets you set the level of severity associated with the classification definition. Severity levels help prioritize and understand the impact of events or incidents categorized under this classification. You can choose from options such as “Info,” “Low,” “Medium,” and “High.”
Info:
The "Info" field allows you to provide additional details, context, or information about the classification definition.
**Advanced Settings:**
Kill Chain Phase:
The "Kill Chain Phase" field allows you to specify the phase of the cybersecurity kill chain to which this classification definition is relevant.
MITRE Tactics and Techniques:
The "MITRE Tactics and Techniques" field provides the ability to link this classification definition to specific tactics and techniques from the MITRE ATT&CK framework. This linkage helps categorize and analyse events based on known attack techniques.
Import:
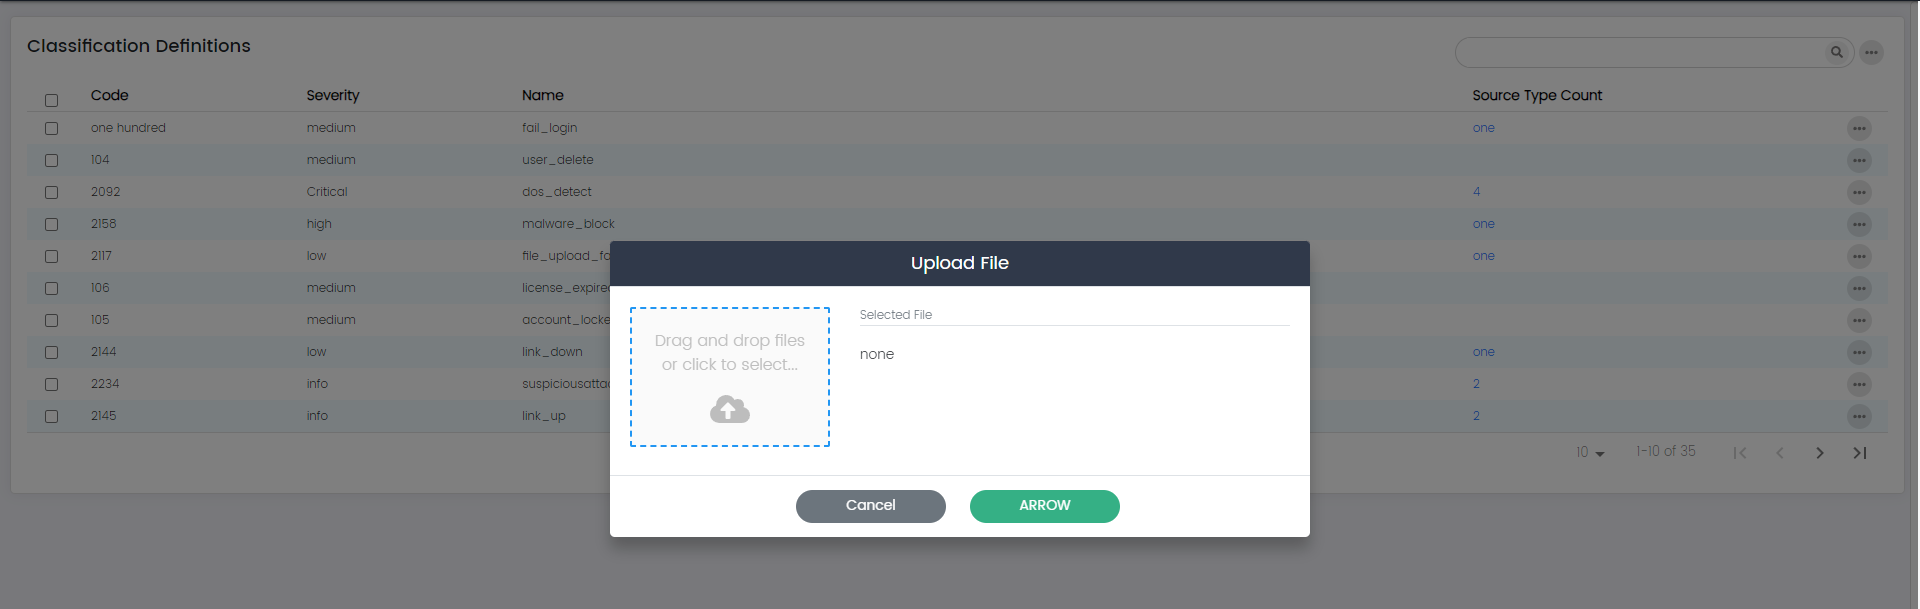
The "Import" option allows you to import classification definitions from an external source. This can be helpful when you want to bring in predefined or standardized classification definitions, saving you time and effort in manual creation.
Export:
The "Export" option enables you to export classification definitions to an external file or format. This is valuable for creating backups, sharing definitions with other systems, or for migration purposes.
Download as module:
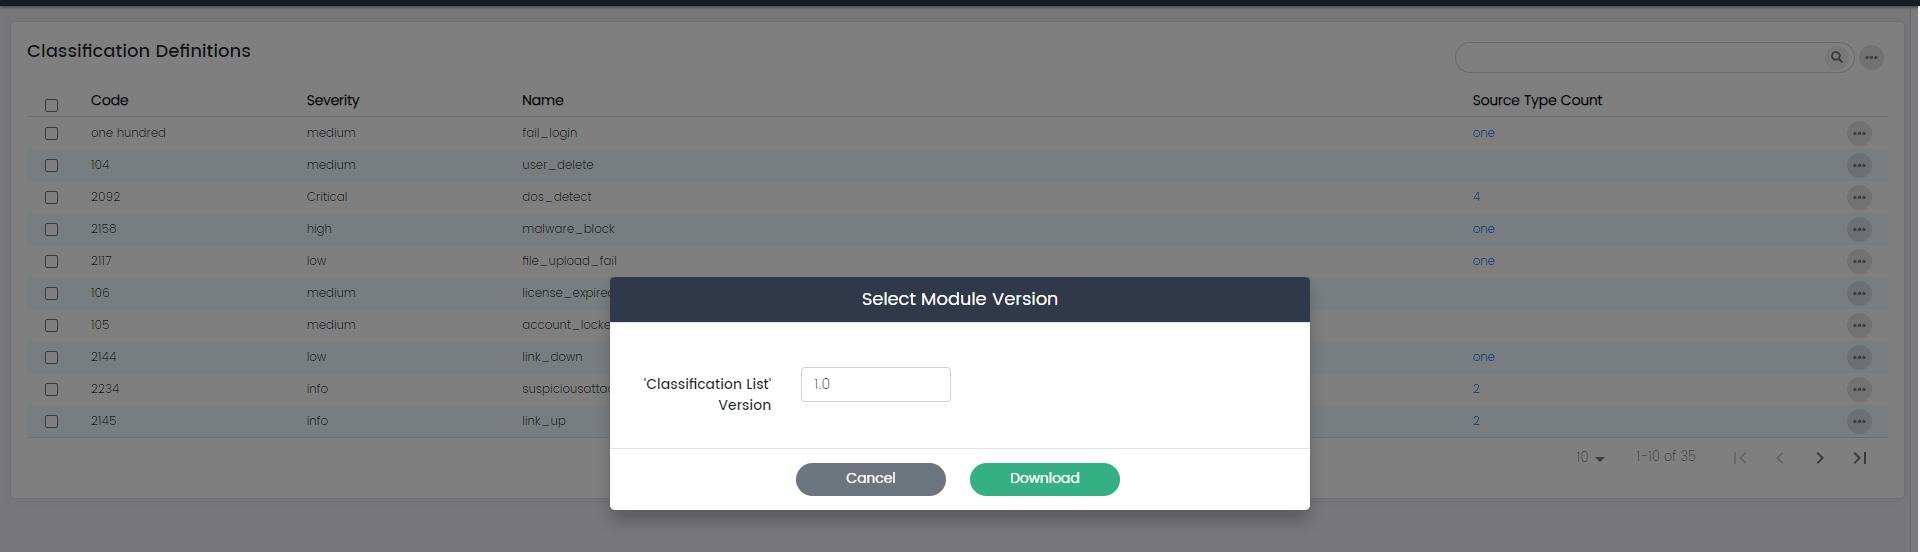
The "Download as module" option allows you to package classification definitions into a module or file that can be easily shared or imported.
Classification: Search
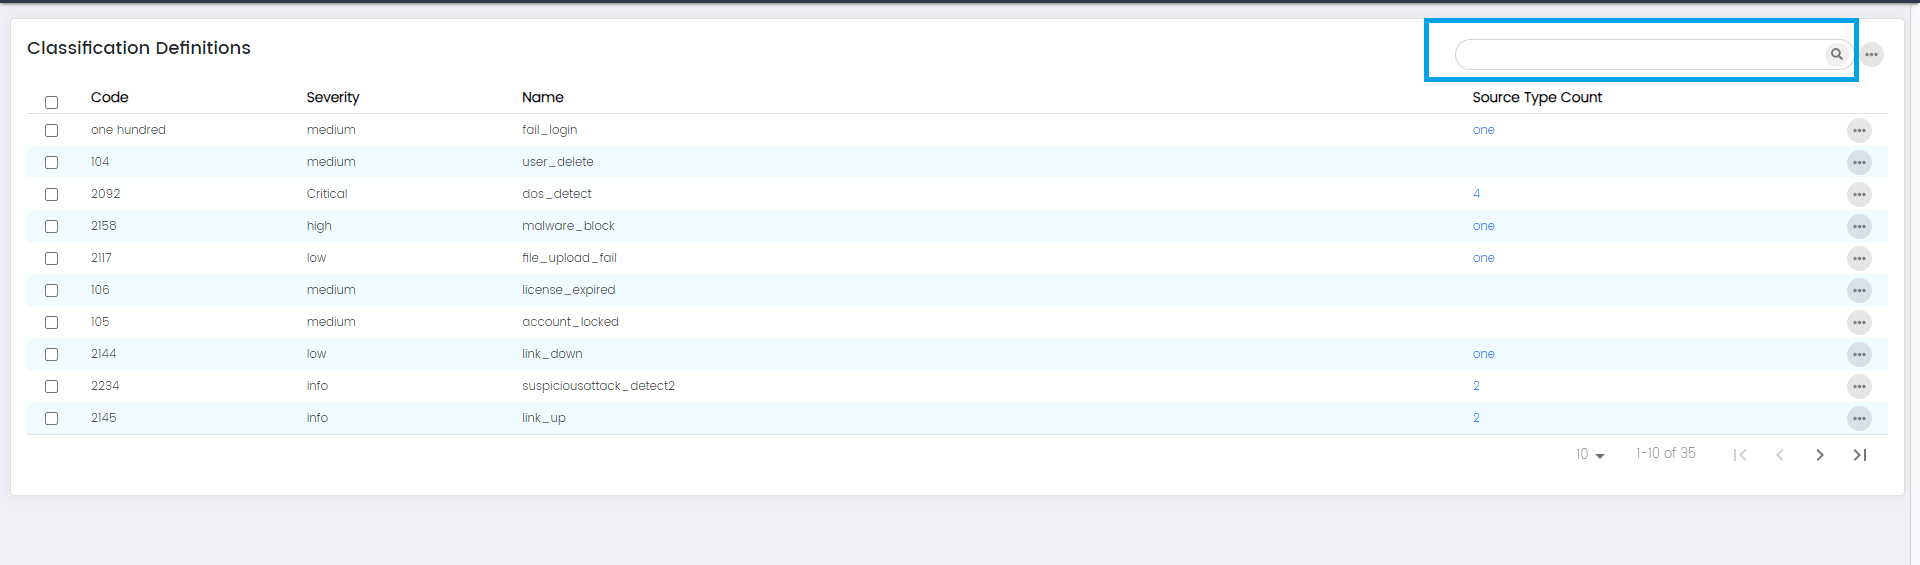
The "Search" option provides a search functionality that enables you to quickly locate specific classification definitions based on keywords or criteria. This feature is particularly useful when you have many classifications and need to find a particular one efficiently.
Each Classification: Options
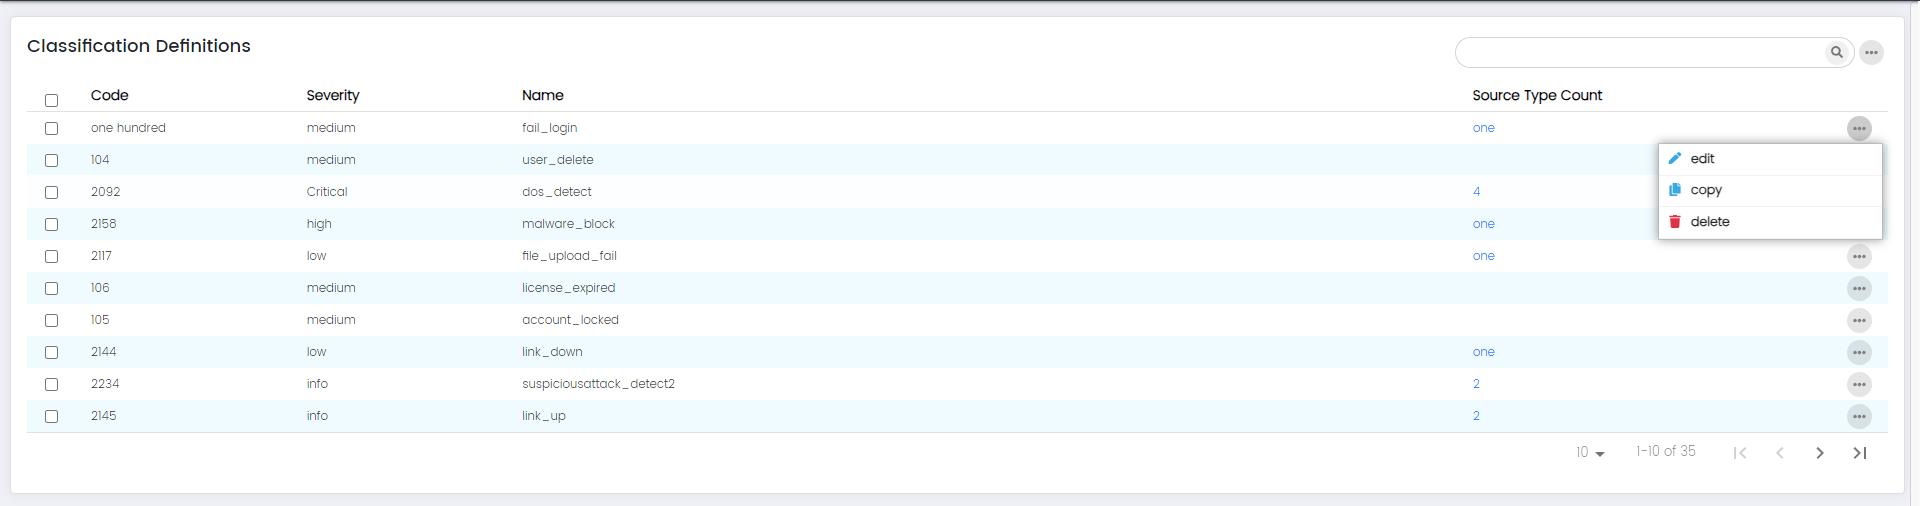
- edit
- copy
- delete
Edit:
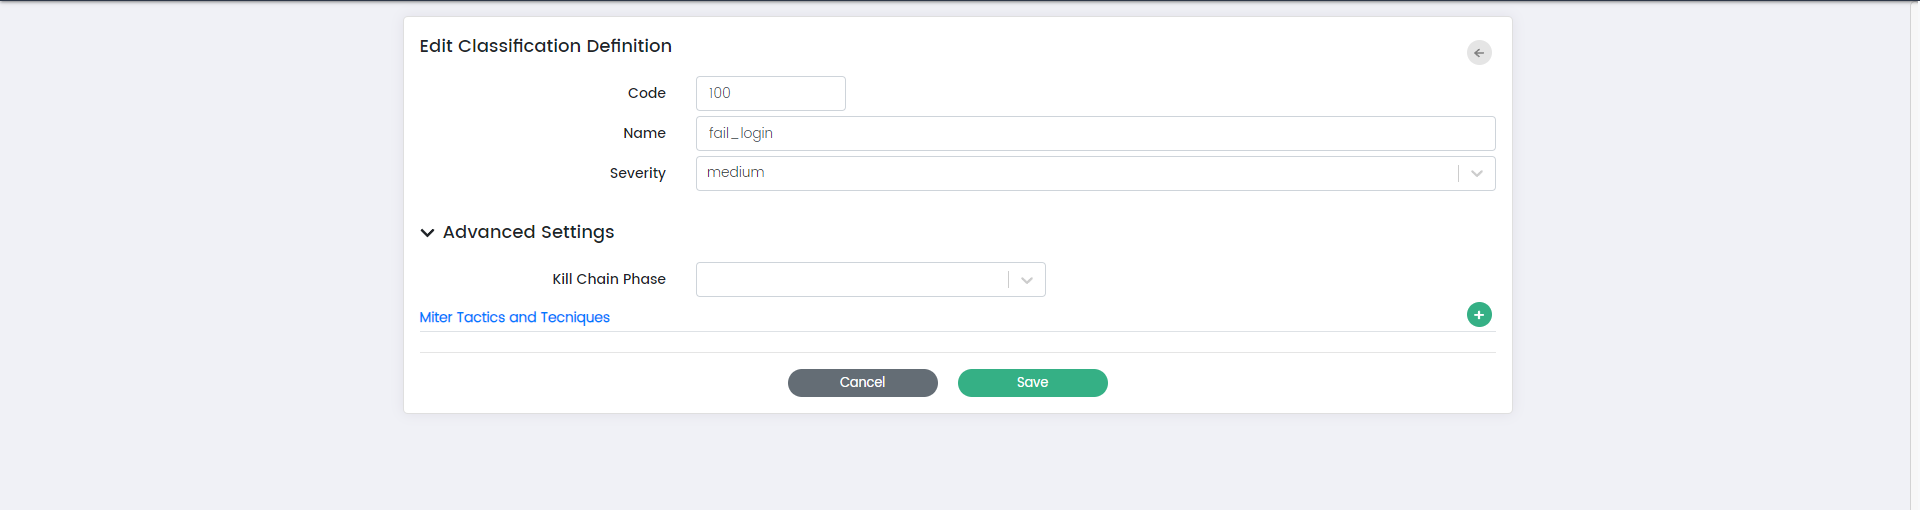
The "Edit" option allows you to modify an existing classification definition. When you select "Edit," you'll be presented with a form that allows you to update the code, name, severity, info, kill chain phase, MITRE tactics and techniques, and other advanced settings associated with the classification.
Copy:
The "Copy" option enables you to create a duplicate of an existing classification definition.
Delete:
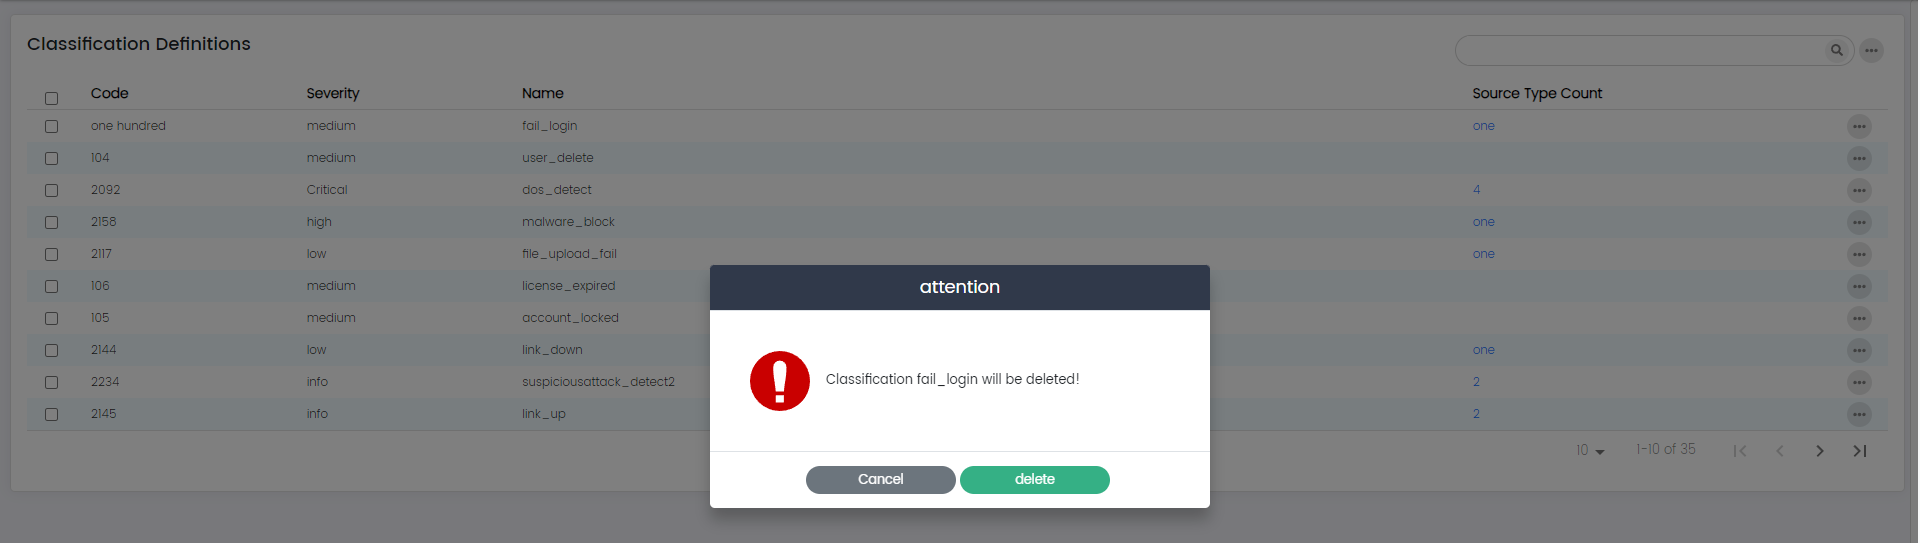
The "Delete" option allows you to remove a classification definition that is no longer needed. When you select "Delete," you'll typically be prompted to confirm the deletion.